Figure 3.
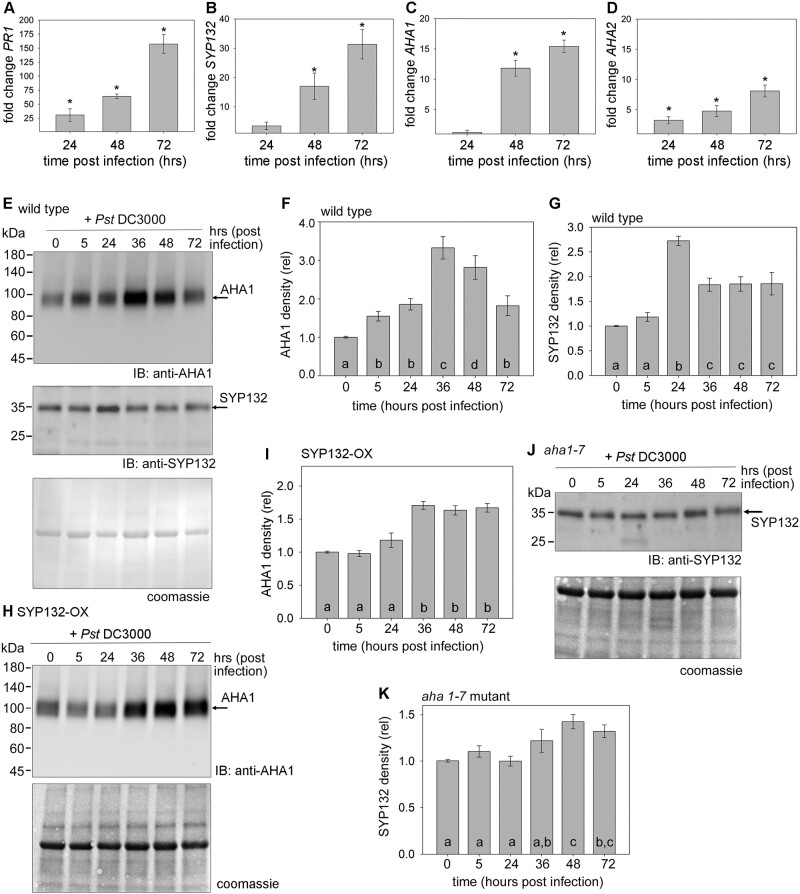
Bacterial infection influences AHA1 and SYP132 expression and protein abundance over time (see also Supplemental Figures S2 and S4). A–D, RT-qPCR analysis of gene expression in wild-type Arabidopsis leaves syringe infiltrated with 10 μL Pseudomonas syringae (Pst DC3000) inoculum at 2.5 × 10⁵ Cfu mL−1 in buffer (10 mM MgCl2). Fold change in gene PR1 (A), SYP132 (B), AHA1 (C), and AHA2 (D) transcripts measured relative to mitochondrial 18s rRNA (AtMg01390) calculated (2−ΔΔCt method, Livak and Schmittgen, 2001) relative to buffer at 24-, 48-, and 72-h postinfection. Since the data were either not normally distributed or had unequal variances, a Kruskal–Wallis ANOVA on ranks was undertaken and a pairwise comparison using Dunn’s method was applied. Data are mean ± se values (P < 0.001) representative of three biological replicates. Leaves were sampled from ≥3 plants for each timepoint in every experiment. E, H, and J, Representative immunoblots of microsomal membrane proteins resolved on SDS-PAGE to detect native proteins AHA1 at ∼100 kDa or SYP132 at ∼35 kDa using anti-AHA1 and anti-SYP132 antibodies, respectively. Microsomes were extracted from Arabidopsis leaves of wild-type (E), pCaMV 35S: RFP-SYP132 Arabidopsis over-expressing SYP132 (SYP132-OX) (H) and aha1-7 null mutant (J) plants infiltrated with Pst DC3000 or with buffer as control (time 0). Total protein in each lane detected using Coomassie stain (bottom panel). Black lines (left) indicate position of molecular mass markers, and black arrows (right) indicate expected band positions. N = 3, using ≥5 plants for each timepoint. (Corresponding immunoblots in Supplemental Figure S4, C, E, and G.) F, G, I, and K, Protein levels in wild-type Arabidopsis calculated for AHA1 (F) and SYP132 (G) in wild-type Arabidopsis, for AHA1 in SYP132-OX plants (I) and SYP132 in aha1-7 mutants (K). Band intensities were measured using ImageJ software, normalized to total protein per lane detected using Coomassie stain, and plotted relative to 10 mM MgCl2 treated control (time 0) for each protein. Data are means ± se protein densities. Letters denote statistically significant differences determined using ANOVA (P < 0.001), N = 3, with ≥5 plants for each timepoint.

