Figure 4.
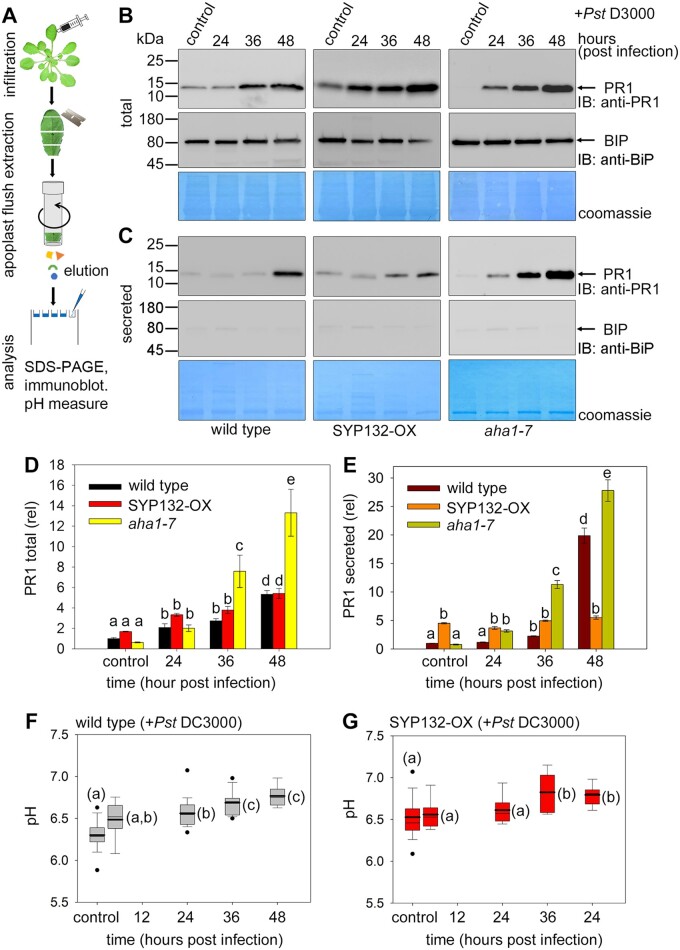
Moderation of AHA1 and SYP132 density affects pH and PR1 secretion during bacterial pathogenesis. A, Schematic for isolation and immunoblot analysis of leaf apoplast flush from Arabidopsis following infiltration with Pseudomonas syringae (Pst DC3000). B and C, Immunoblots of wild-type (left panels), pCaMV 35S: RFP-SYP132 Arabidopsis over-expressing SYP132 (SYP132-OX) (middle panels) and aha1 mutant (aha1-7 allele) (right panels) leaves at different hours postinfiltration with Pst DC3000 inoculum at 2.5 × 10⁵ Cfu mL−1 including at time 0 (control). Blots detect pathogenesis-related protein 1, PR1 at ∼16 kDa using anti-PR1 antibody (top row) and BiP at ∼74 kDa using anti-BiP antibody (middle row). BiP is an ER resident protein and its absence in apoplast-flush indicates purity of the preparations. Coomassie-stained membranes (bottom row) show total protein loading in each lane. Representative immunoblots show (B) Arabidopsis leaf lysates for detecting total protein, and (C) Leaf apoplast flush for detecting secreted proteins. To detect if any BiP was present in the apoplast flush samples, the anti-BiP immunoblot for was exposed for about 5× times longer compared to the total. Purity of apoplast flush samples was ∼99.4%, calculated using the BiP immunoblot as reference, and Figure 4 (continued) factoring in the enhanced band intensity due to over-exposure. Black lines (left) indicate positions of molecular mass markers, and black arrows (right) indicate expected band positions. N = 3 with ≥10 plants for each time point per experiment. D and E, Bar graphs for PR1 total protein (D) and secreted PR1 in apoplast flush (E) calculated from immunoblots of wild-type, SYP132-OX and aha1 mutant Arabidopsis. Data are mean ± se PR1 levels quantified from immunoblots using ImageJ software, normalized to total protein per lane detected using Coomassie stain and plotted relative to wild-type control. Statistical significance assessed using ANOVA is indicated by letters (P < 0.001), N = 3. F–G, Box plots with error bars depicting apoplast flush pH measured from wild-type (F) and SYP132-OX (G) Arabidopsis leaves at different times post Pst DC3000 infection including at time 0 (control). Thin horizontal lines represent the median, bold horizontal lines represent the mean, box limits show the 25th and 75th percentiles. Outliers that exceed their whisker range (1.5× interquartile range) are represented by dots. Apoplast flush collected from three leaves from each plant was pooled, and pH was measured using a micro pH electrode. Statistical significance using ANOVA is indicated by letters (P < 0.001). N = 3 with ≥5 plants for each time point per experiment.

