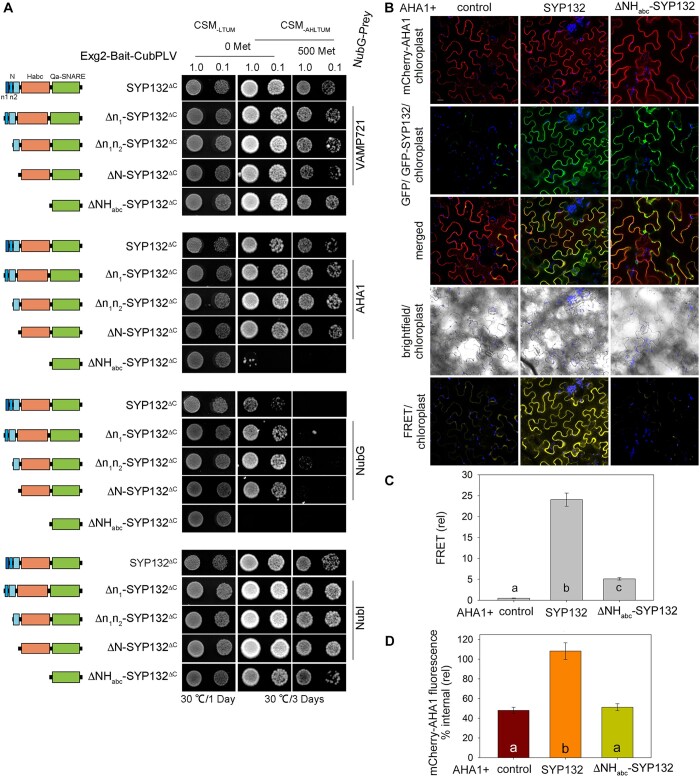
Figure 6.
AHA1 binding with SYP132 N-terminal Habc domain on the SNARE dictates is redistribution from cell periphery. A, Yeast mating-based split-ubiquitin system with GPS to test interaction between baits (schematic on left) SYP132ΔC (M1-Q270) and SYP132 truncation mutants (Δn1-SYP132ΔC (R13-Q270), Δn1n2-SYP132ΔC (E23-Q270), ΔN-SYP132ΔC (G30-Q270), and ΔNHabc-SYP132ΔC (E185-Q270)) and prey proteins VAMP721 or AHA1. Bait proteins were tagged with the Exg2 GPI-signal peptide for membrane anchoring and fused with CubPLV. The prey proteins were fused with NubG. Experimental controls included bait expression with NubG (negative) and NubI (positive). Diploid yeast were dropped at OD600 1.0 and 0.1 dilution and yeast growth was observed on CSM medium without Leu, Trp, Ura, and Met (CSM-LTUM) to verify mating and on CSM medium without Ade, His, Leu, Trp, Ura, and Met (CSM-AHTLUM) to identify bait–prey interactions. Addition of 500 μM Met was included to suppress bait expression as a test for the specificity of interaction. Immunoblots verifying bait and prey protein expression are shown in Supplemental Figure S5, A and B. B, Confocal images of the leaf epidermis infiltrated with water acquired on a single focal plane. Nicotiana tabacum epidermal cells transiently transformed using the bicistronic pFRETgc-2in1-NN vector to co-express mCherry-fused AHA1 and GFP on its own (control) or with Figure 6 (continued) GFP-fused full length SYP132 or mutant ΔNHabc-SYP132. Representative confocal images are overlay with chlorophyll, showing (top-bottom) mCherry-AHA1 (acceptor reference signal, excitation at 552 nm), GFP or GFP-SNARE (donor reference signal, excitation at 488 nm), GFP or GFP-SNARE overlay with mCherry-AHA1, brightfield and mCherry-AHA1 fluorescence (FRET signal, excitation at 488 nm). Scale bar = 20 μm. N = 3. C, Bar graph showing FRET fluorescence signals plotted as ratios [FRET (522)/mCherry (552) relative to GFP(488)]. Fluorescence signal values were corrected for background fluorescence. Data are mean ± se of fluorescence intensity from, ≥30 cells, N = 3. Statistical significance by ANOVA is indicated by letters (P < 0.001). D, Bar graphs show mean ± se internal mCherry-AHA1 fluorescence relative to fluorescence at cell periphery as a percentage. Fluorescence measurements are from plasmolyzed cells to retract the plasma membrane and resolve the cell interior. Images were collected as Z-stacks and rendered as 3D projections (Supplemental Figure S5C) prior to analysis. Region of cell periphery, 1.5 µm width, and cell interior were traced for each cell using the brightfield image as reference. Integrated fluorescence density within the regions of interest was measured and corrected for background fluorescence (see “Materials and methods”). Statistically significant differences by ANOVA are indicated using letters (P < 0.001). N = 3. Data are from ≥6 cells per each experiment, chosen randomly for analysis. Protein expression was verified by immunoblot (Supplemental Figure S5D).

