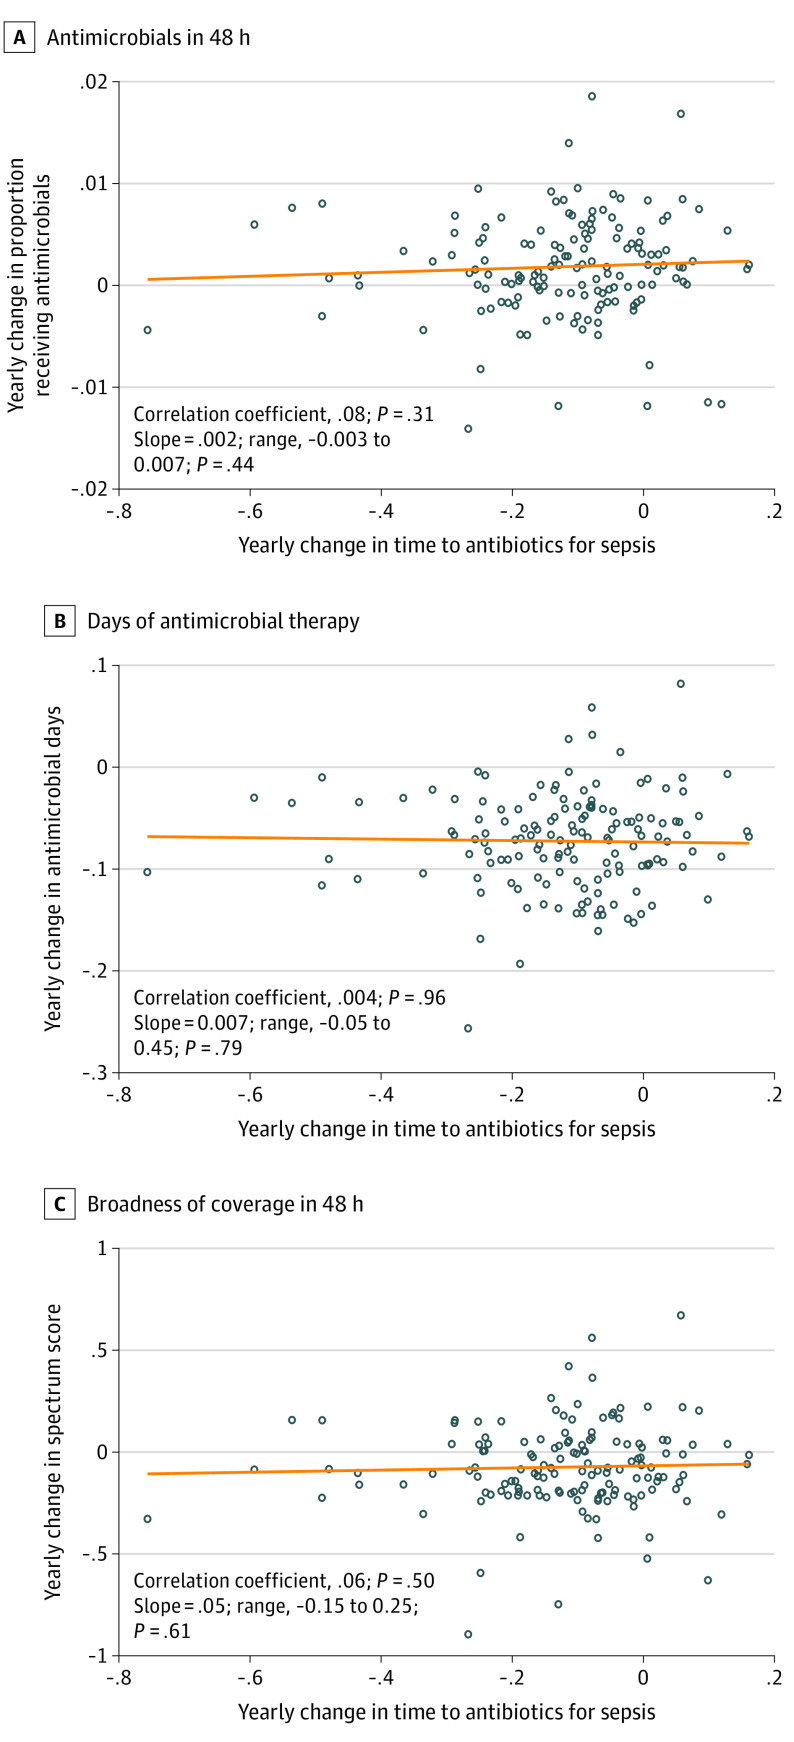
Figure 2. Association Between Hospital-Level Temporal Trends in Antimicrobial Timing for Sepsis and Hospital-Level Trends in Antimicrobial Use, Days of Therapy, and Broadness of Antibacterial Coverage.
In each scatterplot, the exposure (annual change in time to first antimicrobial among hospitalized patients with sepsis) is on the x-axis, and the outcome (annual change in antimicrobial use, days of therapy, and broadness of coverage) is on the y-axis. Each dot represents an individual hospital. The orange line shows the fitted association between temporal trends, estimated from a robust regression in which hospitals were weighted according to number of hospitalized patients. The line at 0 shows no change. The Spearman correlation between temporal trends and the slope from the robust regression are shown in each panel. Broadness of antibacterial coverage was measured using Spectrum Score (range, 0-64, in which higher scores represent broader coverage). There was no association between hospital temporal trends in antimicrobial timing among patients with sepsis and trends in antimicrobial use (A), days of antimicrobial therapy (B), or broadness of antibacterial coverage (C).

