
Fig. 7.
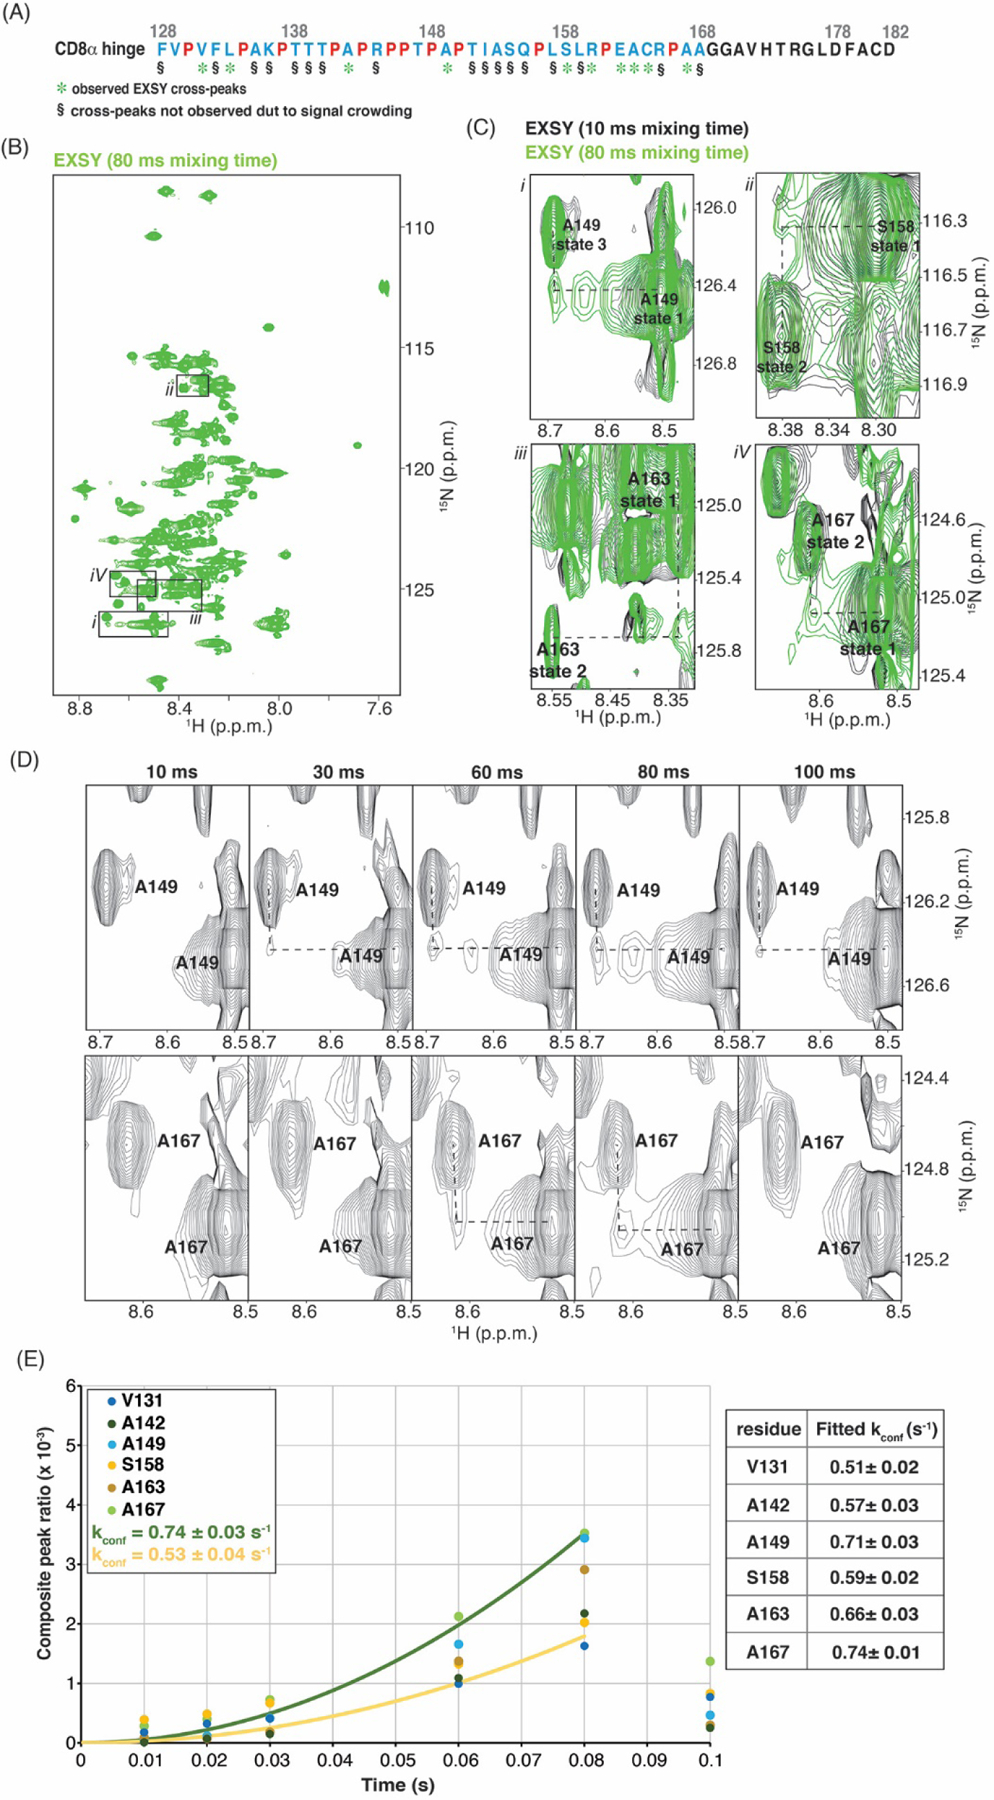
The CD8α H undergoes dynamic exchange. (A) Amino acid sequence of the CD8α H region as in Fig. 4C but with green asterisks below residues that show EXSY exchange signals. (B) EXSY spectrum of the CD8α H with 80 ms mixing time. (C) Enlarged regions of overlaid EXSY spectra with 10 ms (black) and 80 ms (green) mixing time demonstrating cross-peaks for A149, S158, A163 and A167. The enlarged regions are indicated by black boxes in (B). (D) Enlarged regions of EXSY spectra for A149 and A167 with mixing times of 10, 30, 60, 80 and 100 ms. (E) Exchange buildup plotted against time and fit to rate values for selected amino acids (left) with values provided in a table (right). In (B), (C) and (D), all values are given in parts per million (p.p.m.) units.