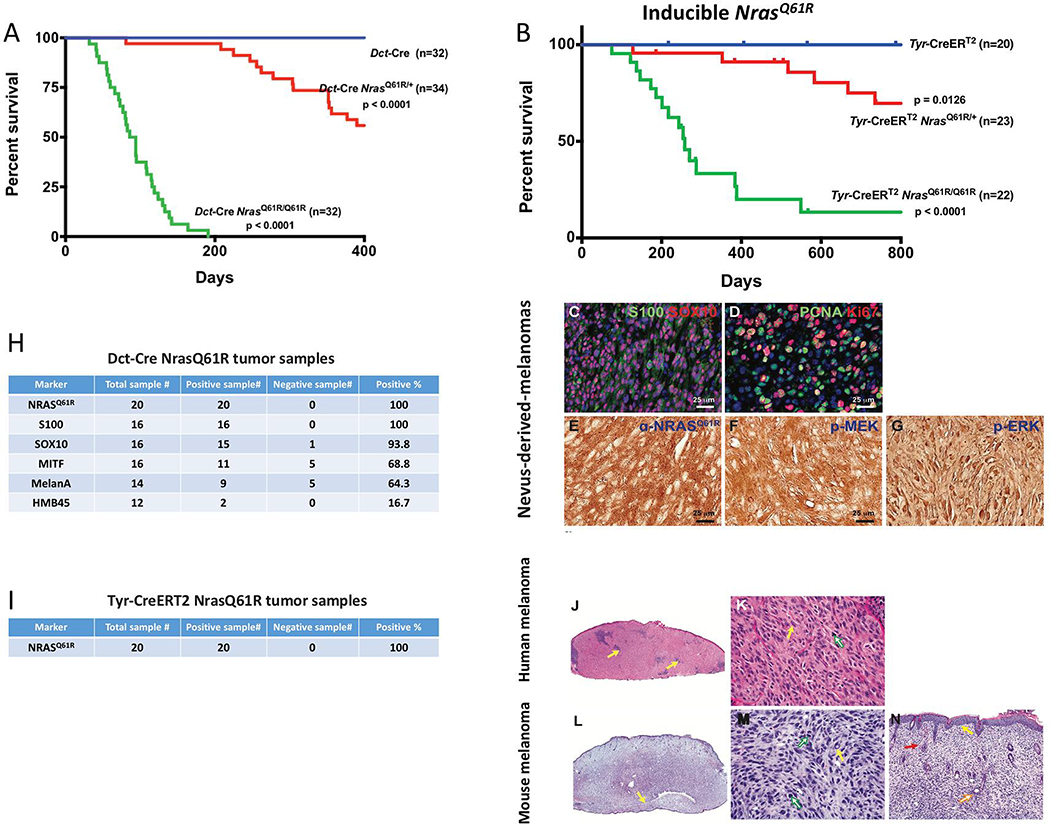
Figure 3. Melanocyte-specific NrasQ61R activating mutation in mice results in high incidence of melanoma with shared histologic features of human melanoma.
(A) Dct-Cre NrasQ61R/Q61R mutant (green, n=35), Dct-Cre NrasQ61R/+ mutant (red, n=34), and Dct-Cre control (blue, n=32) mice were examined to compare the incidence of NrasQ61R mutation-driven melanoma formation. Survival curves were plotted using the Kaplan-Meier method and analyzed by the log-rank test. The tumor-free survival rates were significantly different between the control and Dct-Cre NrasQ61R/Q61R groups (P<0.0001), and between the control and Dct-Cre NrasQ61R/+ groups (P<0.0001). (B) The incidence of NrasQ61R mutation-driven melanomas was measured in tamoxifen-induced Tyr-CreERT2 NrasQ61R/Q61R mutant (green, n=22), Tyr-CreERT2 NrasQ61R/+ mutant (red, n=23), and Tyr-CreERT2 control (blue, n=20) mice. Statistical significance was defined as P<0.05. (C-G) Dct-Cre NrasQ61R tumor sections were immunostained for S100 (C, green), SOX10 (C, red), PCNA (D, green), Ki67 (D, red), NrasQ61R (E, brown), p-MEK (F, brown), or p-ERK (G, brown). (H) Melanocytic markers, including S100, SOX10, MITF, MelanA/MART-1, and HMB45, were assessed by immunostaining in Dct-Cre NrasQ61R tumor samples, and the percentage of positive samples for each marker was calculated. (I) Tyr-CreERT2 NrasQ61R tumor samples were examined using an antibody against NrasQ61R and the percentage of NrasQ61R-positive samples was calculated. (J-K) H&E stained histological images of human melanomas. (L-N) H&E stained histological images of NrasQ61R mutation-driven murine melanomas. are compared with those of. Histologic images at low and high magnifications are shown (J, L, 20x) (K, M, 400x; N, 100x). The infiltrate of human primary malignant melanomas replaces the entire dermis as a sheet, punctuated by nidi of inflammation (J, yellow arrows). The nuclear-to-cytoplasmic ratios, hyperchromatic nuclei, and sometimes multiple nucleoli are shown (K, yellow arrow). The atypical mitotic figure is visible (K, green arrow). The infiltration of murine melanoma can be observed in the ear as a sheet of tumor cells, encircling the cartilage (L, yellow arrow). Severe pleomorphism of the murine melanoma cells, with large nuclear-to-cytoplasmic ratios, hyperchromatic nuclei, and intranuclear vacuoles (M, yellow arrow), and mitotic activity, (M, green arrows) is observed. The murine melanoma abuts the epidermis, with no grenz zone (N, yellow arrow), and invades the hair follicle adventitia (N, orange arrow). The extravasation of red blood cells (N, red arrow), a common finding in human melanoma, is also detected. See also supplemental Figures 3 and 4.

