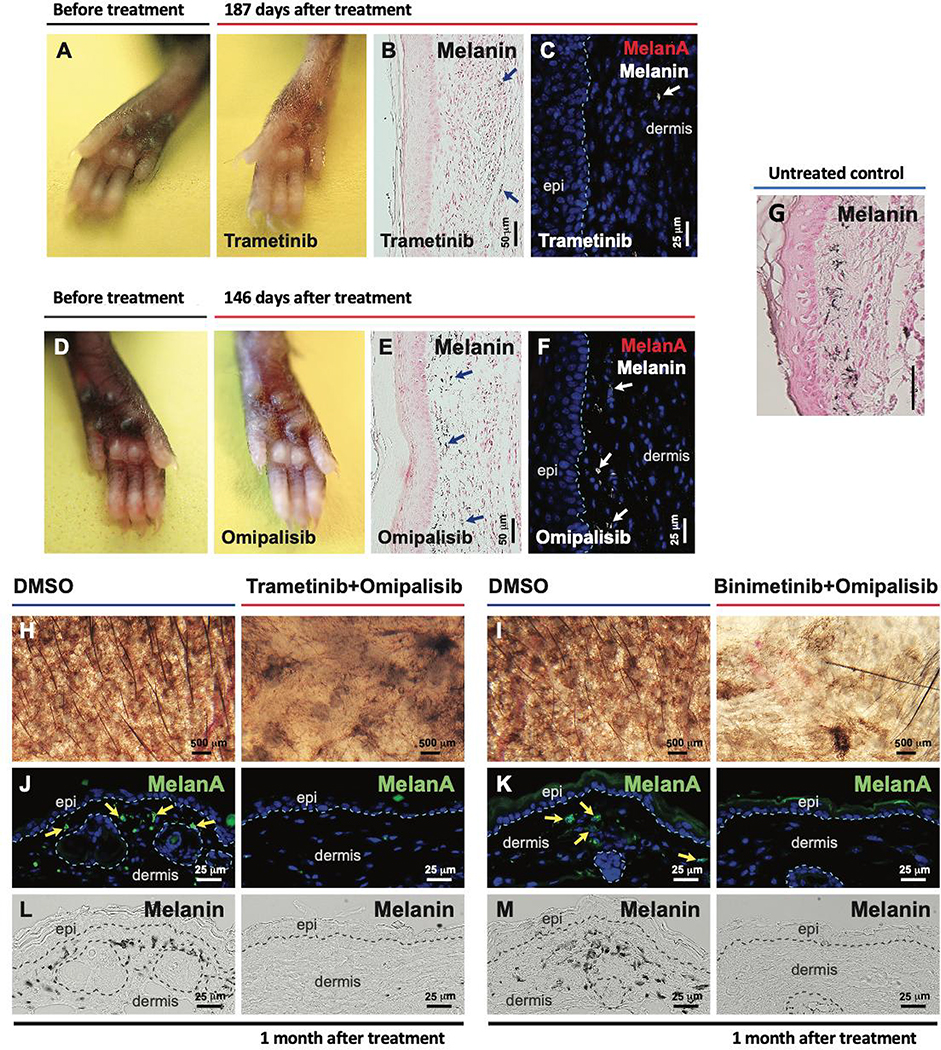
Figure 4. Local therapy with small molecule inhibitors of the NRAS signaling pathway regress NrasQ61R-driven melanocytic nevi.
(A-F) NrasQ61R mutation-driven nevi were induced in Tyr-CreERT2 LSL-NrasQ61R newborn mice with tamoxifen over the first postnatal week, and 2 months later local treatments of senescent nevi were initiated with MEK and/or PI3K inhibitors or DMSO vehicle control. Trametinib (A-C, 0.1 μg /μl) or omipalisib (D-F, 0.03 μg /μl) was subcutaneously injected into the pigmented paws of tamoxifen-induced Tyr-CreERT2 NrasQ61R/+ heterozygous mutants in 10 μl of 10% DMSO, three times per week for two weeks. Paws were visualized 187 days after treatment with Trametinib (A) or 146 days after treatment with omipalisib (D). Melanin (B, and E, blue arrows) was detected by Fontana-Masson staining. Tissue sections were stained for MelanA/MART1 (C, F). White arrows (in C and F) indicate dermal melanin detected by bright-field microscopy. (G) Representative image of melanin detected by Fontana-Masson staining of non-treated tamoxifen-induced Tyr-CreERT2 NrasQ61R/+ mice from postnatal day 16, 2 weeks after tamoxifen induction. (H-M) Topical combinatorial therapies. Topical combinatorial therapies with the PI3K inhibitor, omipalisib (10 μg/ μl), plus the MEK inhibitor, trametinib (H, J, L, 2 μg/ μl) or binimetinib (I, K, M, 10 μg/ μl), were applied to the pigmented ears of tamoxifen-induced Tyr-CreERT2 NrasQ61R/Q61R mutant mice. All topical agents were administered in 5 μl DMSO, five times per week for 3 weeks (‘Trametinib+Omipalisib’ and their vehicle control treatments) or for 6 weeks (‘Binimetinib+Omipalisib’ and their vehicle control treatments). Ear skin tissues were harvested 1 month after the final drug treatment, and nevus regression was examined. Images were obtained with a stereomicroscope, and the dark brown particles indicate melanin (H, I). Tissue sections were stained for MelanA/MART1 (J, K, green). Yellow arrows indicate positive signals. Dermal melanin detected by bright-field microscopy is shown (L, M, black). We used five mice per treatment group, and representative images are shown. See also supplemental Figure 5.

