Figure 4.
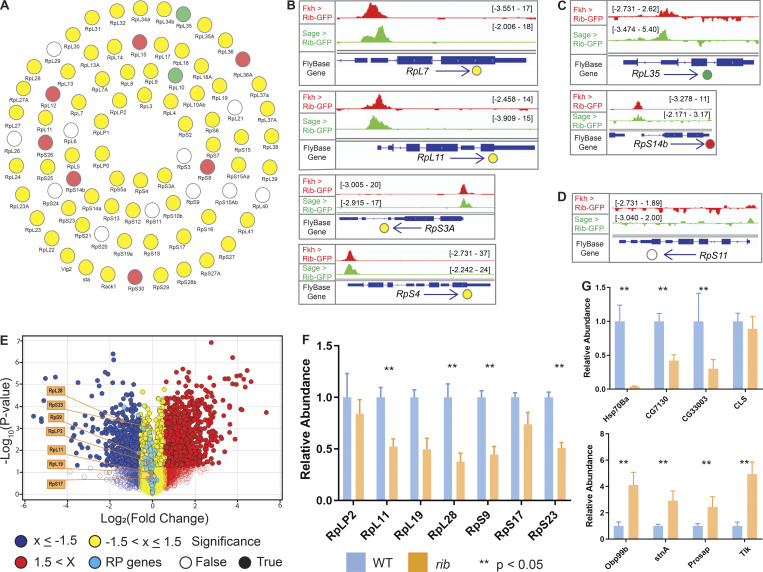
Rib immunoprecipitates RPGs and is required for their full levels of expression. (A) Schematic summary of Rib binding to SG-expressed RPG promoters. Filled circles represent genes bound by Rib (log10 binding likelihood threshold ≥4). Unfilled circles represent genes not bound by Rib (log10 binding likelihood threshold <4). Yellow, set of genes bound by Rib and above threshold in both fkh-GAL4 and sage-GAL4 experiments; red, set of genes bound by Rib and above threshold in the fkh-GAL4 experiment only; green, set of genes bound by Rib and above threshold in the sage-GAL4 experiment only. (B) Representative binding profiles of Rib-GFP for genes with peaks from both datasets (fkh-GAL4 > UAS-rib-GFP and sage-GAL4 > UAS-rib-GFP): RpL7, RpL11, RpS3A, and RpS4. Binding profiles from the fkh-GAL4 and the sage-GAL4 datasets are shown by red and green tracks, respectively. Signal intensity range for the regions shown are in brackets. See Figs. S1, S2, S3, S4, and S5 for all RpG binding profiles. (C) Representative binding profiles of Rib-GFP for genes with peaks (log10 binding likelihood threshold ≥4) in only one of the datasets: RpL35 (sage-GAL4 > UAS-rib-GFP) and RpS14b (fkh-GAL4 > UAS-rib-GFP). Note that although the alternate track did not meet the binding threshold (≥4), its signal peak overlaps the signal peak that did. (D) Representative signal profile of Rib-GFP on an RPG from Rib-not-bound category (log10 binding likelihood <4 in both datasets): RpS11. Note that although neither track meets the binding threshold (≥4), the highest signal, nonetheless, spans the TSS. (E) Volcano plot of whole-embryo microarray gene expression analysis shows genes downregulated (blue) or upregulated (red) ≥1.5-fold in rib-null embryos compared with WT. Transcripts with fold-change values between −1.5 and 1.5 are shown in yellow. Unfilled circles represent transcripts with fold-change values that were not statistically significant between the groups, i.e., P > 0.05. RPGs are highlighted by cyan circles. A majority of RPG transcripts were downregulated in the rib mutants compared with WT. Named RPGs (orange) belong to the subset whose levels were also examined by RT-qPCR analysis. See Table S2 for metadata. (F) RT-qPCR results from whole embryo transcripts for several RPGs show reduced expression levels in rib mutants compared with WT, with most showing a significant decrease. **, P < 0.05; Mann–Whitney U test. (G) Nonribosomal Rib targets show both decreased (top) and increased (bottom) expression in rib mutants compared with WT. **, P < 0.05; Mann–Whitney U test. Data from Loganathan et al., 2016.

