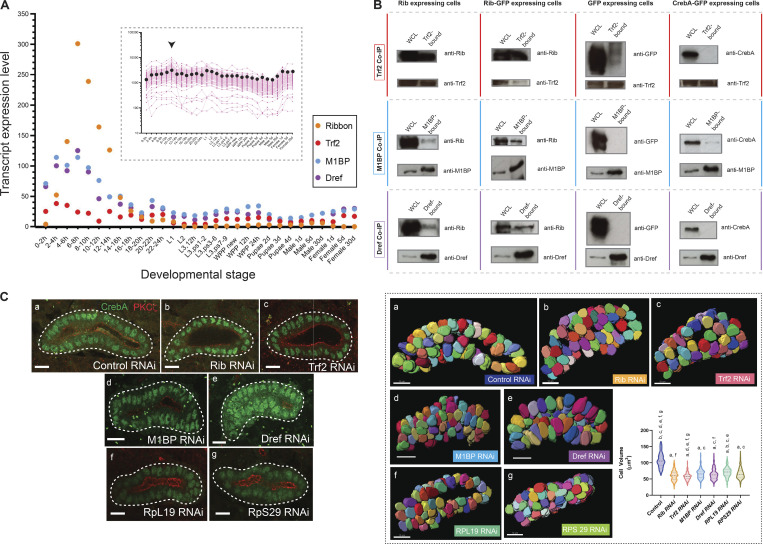
Figure 7.
Rib coimmunoprecipitates with known transcriptional regulators of RPGs, and isolated RNAi knockdown of Rib-interacting RPG regulators or individual RPGs result in embryonic SG cell growth defects. (A) Transcript expression profiles of rib, Trf2, M1BP, and Dref during Drosophila development. The highest-level expression of all four genes occurs during embryonic stages. Inset: Transcript expression profiles for all 84 RPGs across developmental stages reveals the relatively high levels achieved during 10–12 h of embryogenesis (arrowhead). Pink tracks, individual RPGs; black dots, median values. Source data for the plots obtained from FlyBase (modENCODE temporal expression data). (B) Co-IP experiments performed in S2R+ cells transfected with constructs expressing UAS-rib, UAS-rib-GFP, UAS-GFP, and UAS-CrebA-GFP (the latter as negative controls), respectively. All three co-IP fractions—Trf2-bound, M1BP-bound, and DREF-bound—contain both Rib and Rib-GFP. WCL, whole cell lysate. Size (kD): Rib, ≈70; CrebA, ≈57; Trf2 short-form, ≈75; M1BP, ≈55; Dref, ≈86; and GFP, ≈30. Western blots with the Trf2 antibody consistently produced high background signal, and a weak GFP signal was observed in the TRF2-bound fraction of GFP-expressing cells. The weak CrebA signal observed in the M1BP-bound fraction of CrebA-GFP–expressing cells was absent in the biological replicate experiment. Two experiments were performed as complete sets of co-IPs; multiple (more than three) individual co-IPs were performed on select fractions. (C) Left: Cell growth deficit is observed in SG RNAi knockdown of Rib, Trf2, M1BP, Dref, and either of the two representative RPGs, RpL19 and RpS29, in stage 15–16 embryos. Right: Quantitative analysis of cell volumetric data from 3D renderings of manually segmented whole secretory cells. A total of 1,050 cells from 21 SGs were 3D rendered. n = 150 cells/genotype; median and quartiles; Kruskal–Wallis test; significant difference indicators: P < 0.05 from each group mean compared with (a) GFP RNAi control, (b) Rib RNAi, (c) Trf2 RNAi, (d) M1BP RNAi, (e) Dref RNAi, (f) RpL19 RNAi, and (g) RpS29 RNAi. Scale bar: 10 µm. Source data are available for this figure: SourceData F7.

