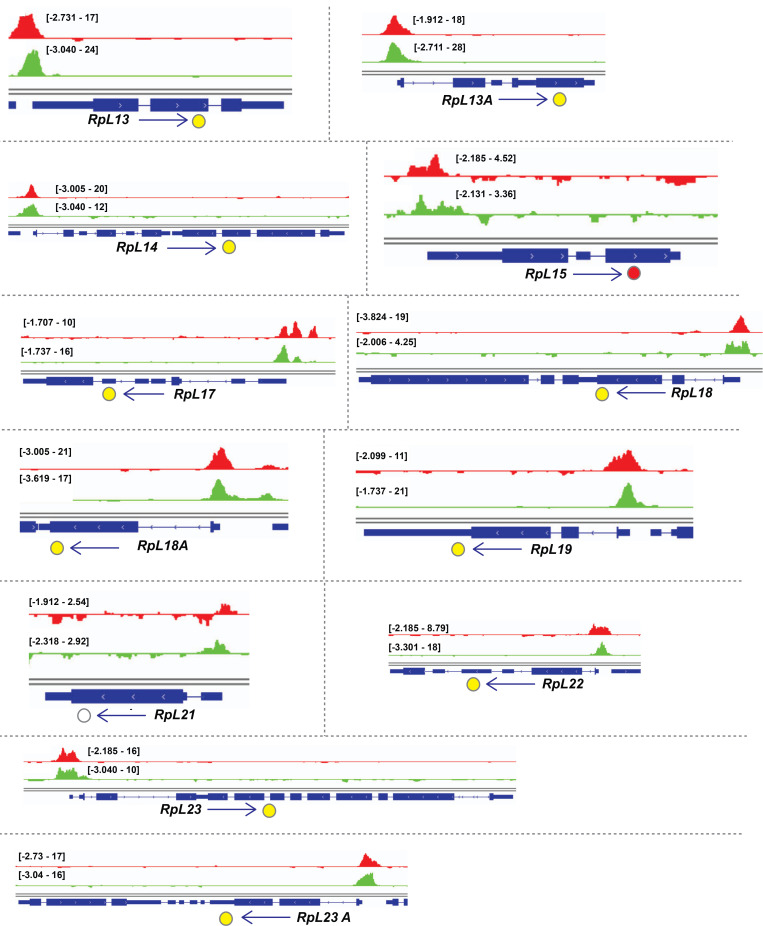
Figure S2.
Binding tracks from Rib-GFP ChIP-seq for all SG-expressed RPGs. (Related to Fig. 4.) fkh-GAL4 > UAS-rib-GFP tracks are in red; sage-GAL4 > UAS-rib-GFP tracks are in green. The colored circles correspond to the individual track colors when either of the binding peaks reaches the enrichment threshold of log10 binding likelihood ≥4. In cases where both the binding peaks meet the enrichment threshold, the circles are yellow. In cases where both peak thresholds are <4, the circles are unfilled. Note that even when the enrichment threshold was <4, binding signals for the region shown are often highest at the RPG TSS.

