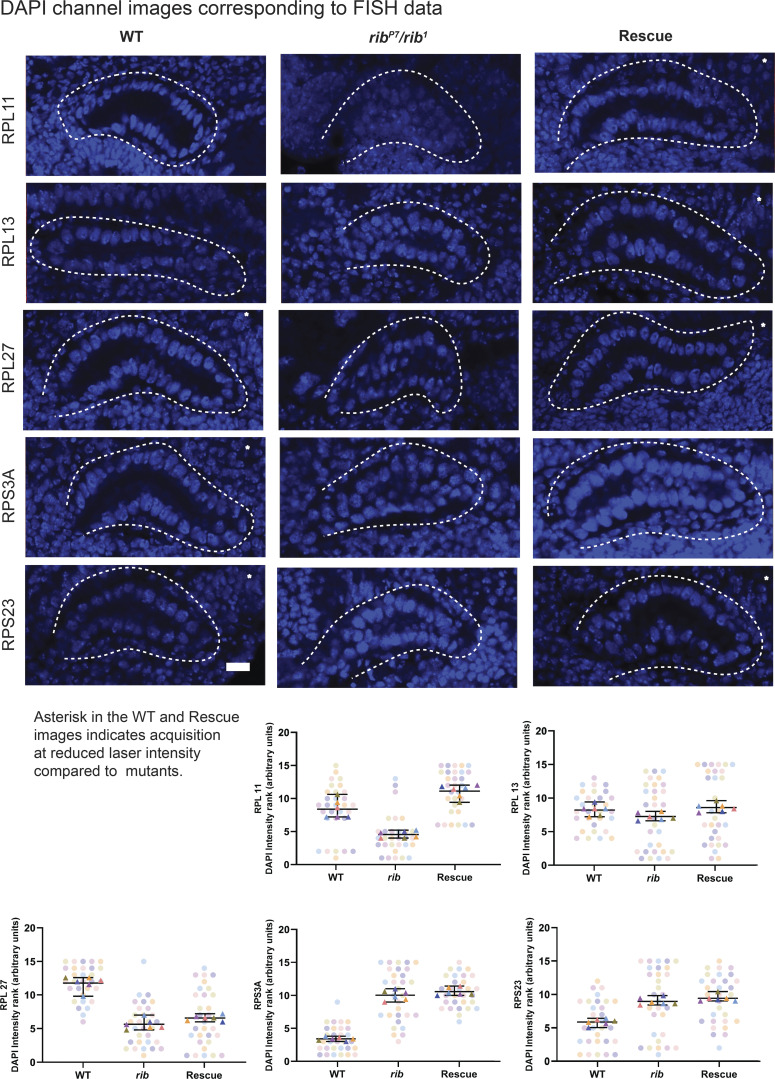
Figure S7.
DAPI channel images from the FISH experiment. (Related to Fig. 5.) Top: DAPI channel images for the corresponding representative images from RPG FISH experiments shown in Fig. 5. Bottom: SuperPlots for DAPI intensity showed that the ranking of blind samples does not follow an order consistent with the ordering of RPG probe intensity, i.e., WT or rib SG rescue followed by the rib mutant for RPG probe rankings (Fig. 5) versus no concordant group order for DAPI rankings. Scale bar: 10 µm.

