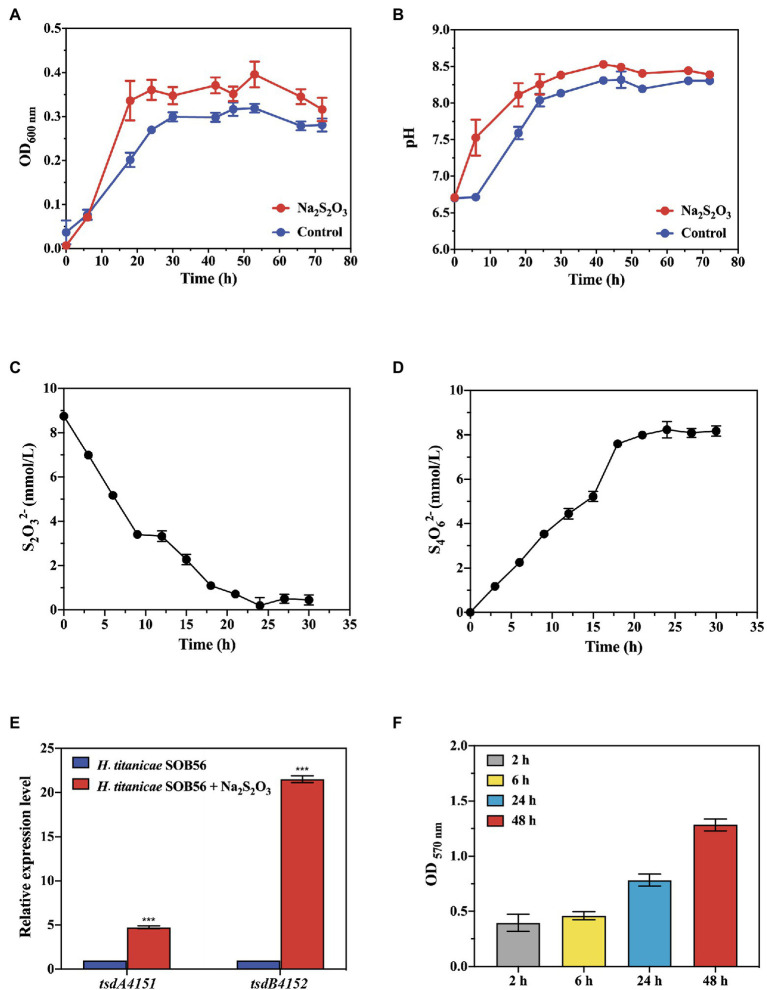
Figure 2.
The growth of train SOB56 and its Na2S2O3 oxidizing ability. (A) The change of OD600 nm. (B) The change of pH. (C) The change of S2O32− concentration. (D) The change of S4O62− concentration. (E) Expression of genes tsdA4151 and tsdB4152 in Halomonas titanicae SOB56. Three biological replicates and three technical replicates were used for each gene/condition. The error bars represent the standard deviations for three replicates. For statistical analysis, significance was analyzed with a t-test of unpaired unequal variance, ***p < 0.01. The error bars represent the standard deviations for three replicates. (F) Biofilm formation of H. titanicae SOB56.

