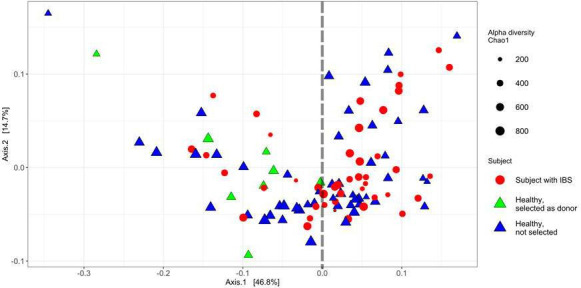
Figure 2.

Ordination plot on the weighted UniFrac distance at the genus level for selectionof the donor candidates based on their gut microbiome alpha diversity and beta diversity. These are the results of a comparative microbiome case–control study which helped us to preselect 14 donor candidates. Alpha diversity calculation was based on Chao 1 index. The beta-diversity calculation was based on Non-Metric Dimensional Scaling (NMDS) with weighted UniFrac distance matrix for bacterial genus. NMDS axis 1 captured 46.8% of variability; NMDS axis 2 represents 14.7% of the variability. Healthy subjects were enriched in negative values of the first ordination axis; therefore, we selected donors among healthy subjects in this half of the graph and based on their microbiome’s alpha diversity. The reason for concentrating healthy and enriched subjects in the left part of the plot could be their younger age. IBS, irritable bowel syndrome.
