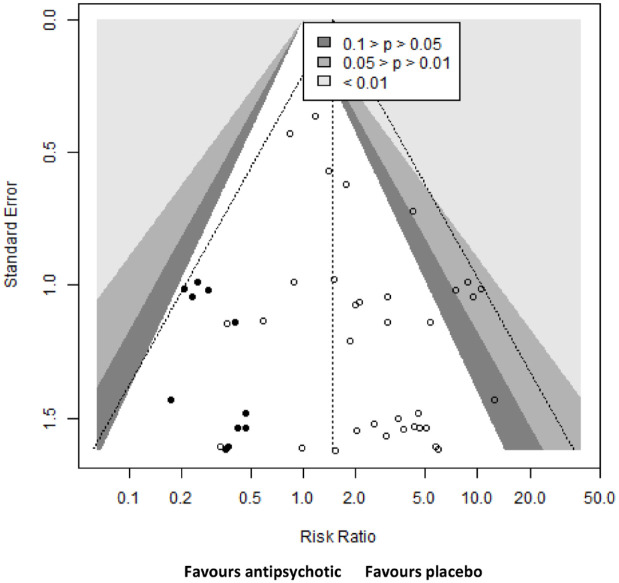
Figure 4.
Contour-enhanced funnel plot for all antipsychotics compared with placebo.
Risk of tachycardia events of all antipsychotics compared with placebo. Circles represent effect sizes of individual studies measured as risk ratio. Missing studies were estimated using the trim-and-fill method. Original effect sizes are represented by empty circles and estimated ones by filled circles.

