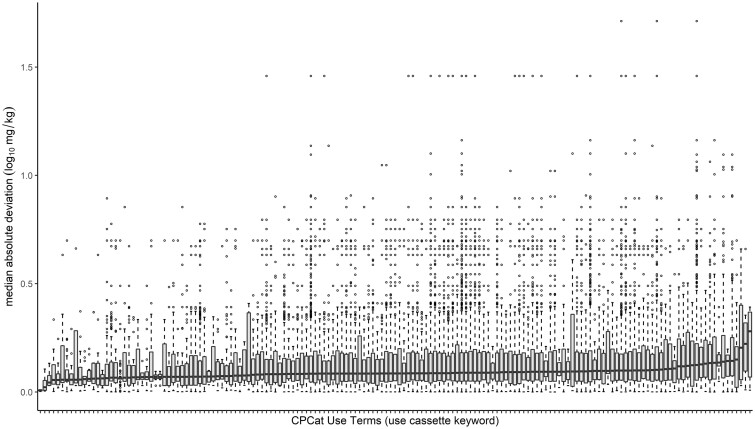
Figure 4.
Evaluation of LD50 median absolute deviation (MAD) per chemical use category. The 1619 chemicals with at least 2 discrete point estimate LD50 values could be mapped to chemical use categories in CPCat. Chemicals were associated with anywhere from 1 to 128 use terms among 181 unique use categories present in the data set. The 161 use category terms having at least 3 chemicals mapped are all represented across this figure (ie, each respective boxplot along the x-axis). The boxplots represent the distribution of LD50 MADs (in log10 mg/kg units) for the chemicals associated with each use term, respectively. Although the MAD across the chemicals mapped to each use term increases from left to right across the plot, the range of MADs (boxplots) generally overlap, confirming that there is no use term with significantly lower/higher variable chemicals.

