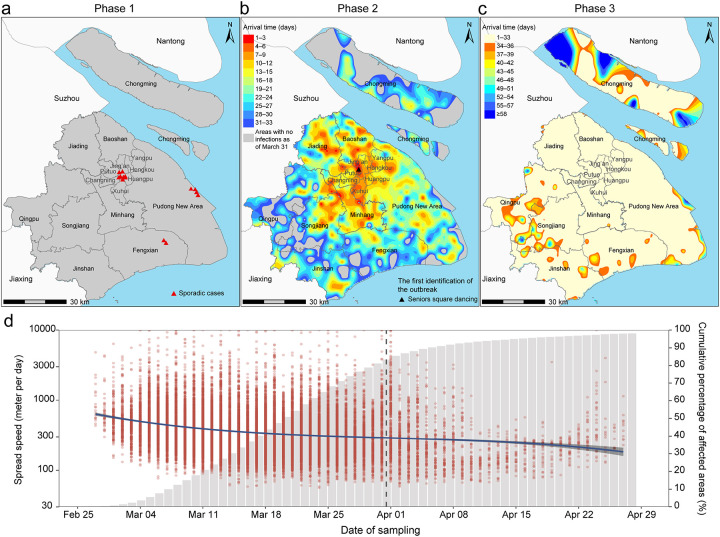
Figure 4. Spatial trends and speed of spread of the epidemic in the three phases.
(a) Spatial location of the reported infections during the first phase of the epidemic. (b-c) Estimated arrival time of the epidemic in the different areas of Shanghai. Estimates are based on the thin spline regression of the interval between the time of the detection of the first infection in each 3 km × 3 km grid and February 27, 2022. Triangles indicate the potential source of the outbreak. (d) Estimated speed of spread of SARS-CoV-2 (left axis) and cumulative fraction of affected areas of Shanghai (right axis). Red dots indicate the speed of spread over time in each cell. The blue line indicates the average speed per day as obtained using a polynomial regression. Central areas contain the districts of Jing’an, Yangpu, Hongkou, Putuo, Changning, Xuhui, and Huangpu.

