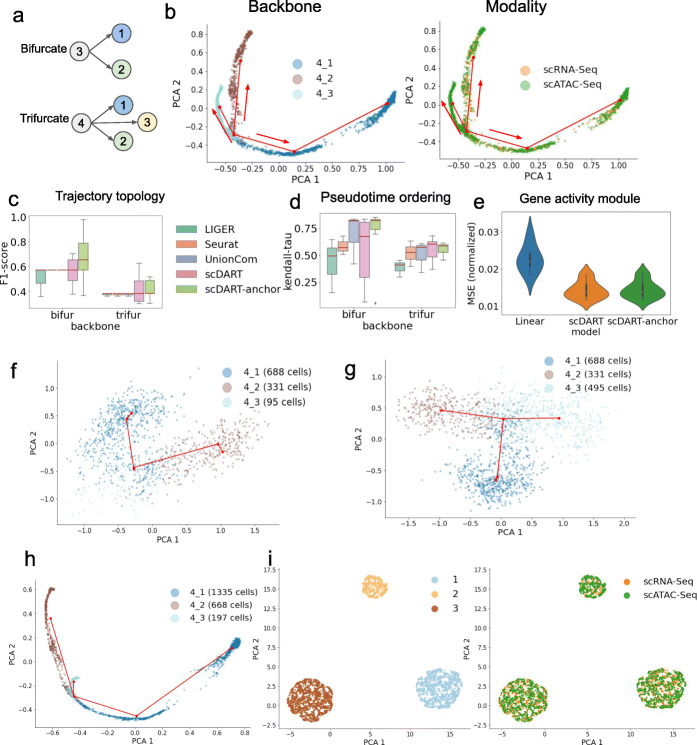
Fig. 5.
Performance of scDART on simulated datasets. a Ground truth trajectory topology of simulated continuous datasets. b The latent embedding of scDART from one simulated data with trifurcating trajectory backbone. Red lines show the inferred backbone, and arrows show the trajectory direction. Left: cells colored by the ground truth trajectory branches they belong to; Right: cells colored by the data batches. c, d Boxplots of F1-score and Kendall- τ score calculated from different methods. 3 datasets were used for each type of trajectory, and for each dataset scDART and scDART-anchor were run 3 times. Seurat and UnionCom have the same F1 score on all 3 datasets with bifurcating trajectory. e Violin plots of normalized MSE between pseudo-scRNA-seq and ground truth scRNA-seq. f Trajectory backbone learned from scRNA-seq when branch 4_3 has only 95 cells. g Trajectory backbone learned from scRNA-seq when branch 4_3 has 495 cells. h Trajectory backbone learned from latent embedding integrated by scDART where when branch 4_3 has 197 cells (95 from scRNA-seq and 102 from scATAC-seq). i The latent embedding of scDART on one dataset with discrete clusters. Left: cells colored with cell type annotations; Right: cells colored with data batches

