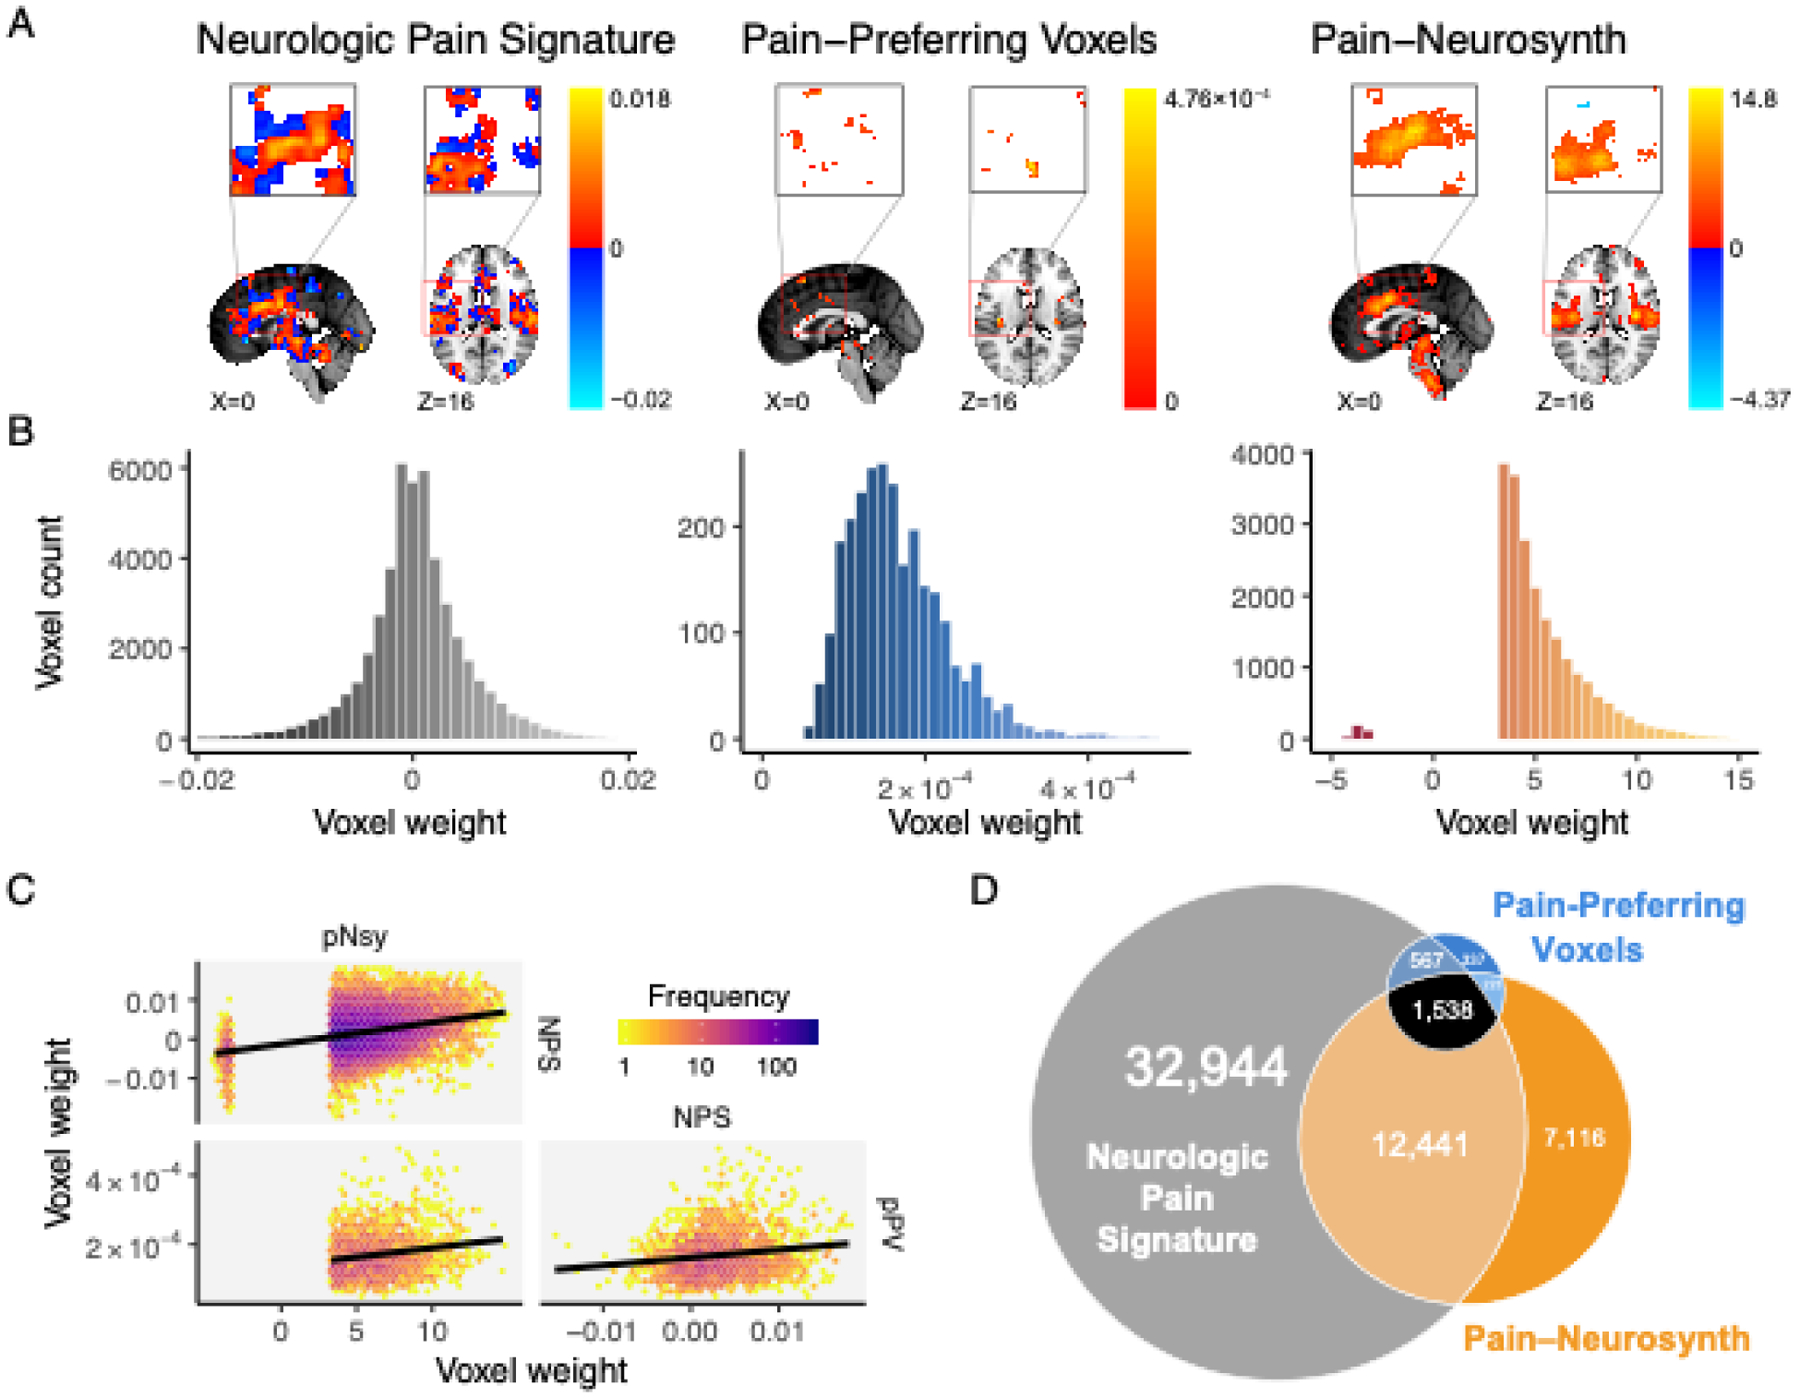
Figure 1. Spatial properties for three decoders, which are supposed to distinguish pain from other mental states, are distinct from each other.

(A) Location and voxel-wise weight patterns of the three pain decoders (respectively abbreviated NPS, pPV, and pNsy). (B) Weight distributions of all three decoders are distinct. NPS weight values are distributed around zero; pPV has no negative weights; pNsy has only a few negative weights. (C) Pairwise correlations between weights of the three decoders. Lines depict total least squares regression fits. All three correlations are weak (rNPS-pPV = 0.16; rpNsy-NPS = 0.30; rpNsy-pPV = 0.18). (D) Euler diagram depicts relative size of each of, and spatial overlap between, the three decoders.
