
Figure 3. Discrimination performance is similar for all three pain decoders and is a function of voxel locations, not weighted patterns.
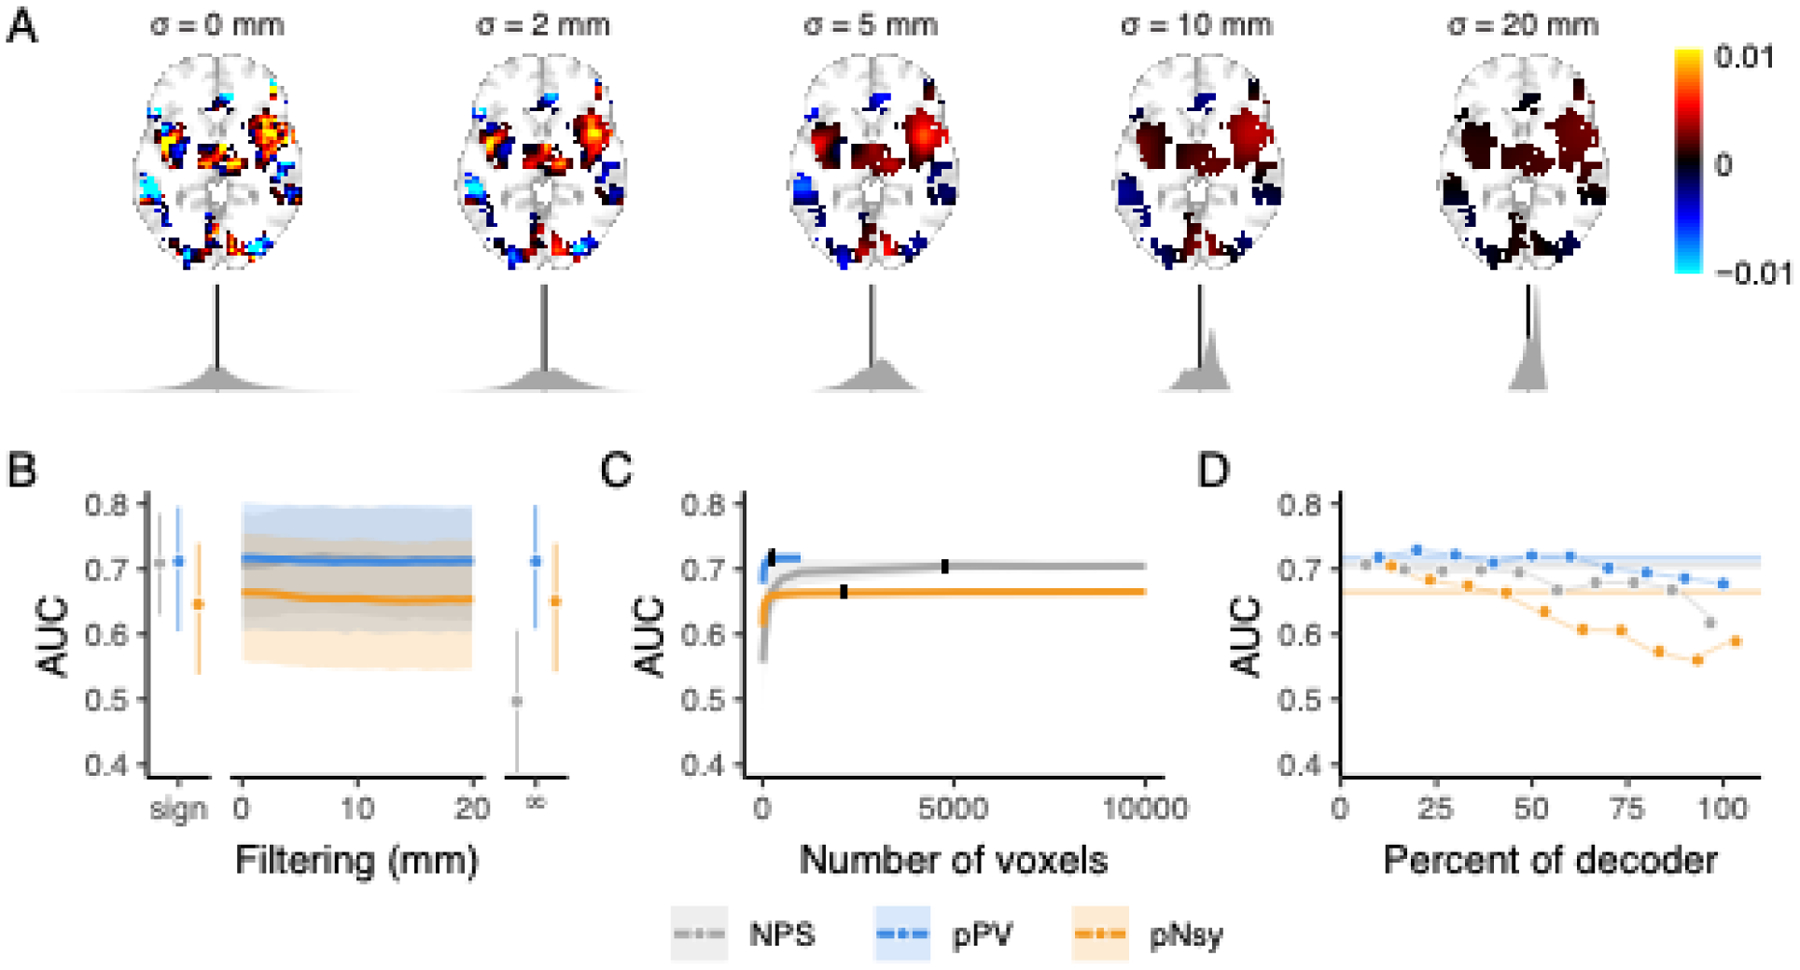
(A) Example of spatial smoothing and its effects on decoder weight distributions. Here, we applied spatial smoothing to NPS with standard deviations of 0 (no smoothing), 2, 5, 10, and 20 mm. Note that smoothing was only applied within the extent of the original decoder (non-zero voxels). The fine-grain pattern observed with no smoothing is quickly destroyed (i.e., already visually by 5 mm smoothing), and at 20 mm of spatial smoothing, the pattern that is left hardly resembles the original decoder. Kernel densities below each brain (grey) are the distributions of voxel weights (black line = 0). With more spatial smoothing, the distributions become more homogeneous and converge toward their mean positive weight. (B-C) Across-subject decoding of pain from touch using Dataset 2 (Liang et al., 2019). (B) Performance does not change when decoder pattern weights were distorted with increasing-size spatial smoothing. Sign = sign of original voxel weights, rendering decoder weights of 0, −1, and +1; filtering σ = 0–20 mm; ∞ = infinite smoothing rendering a binary map. (C) Decoder performance depends only on a very small number of voxels, indicating information redundancy. The number of voxels constituting each decoder was systematically increased (from 10 voxels to the full decoder) and performance assessed for random samples of each size. 10% of each full decoder’s voxel count (black ticks) discriminates pain from touch equivalently to the full decoders. Shades are standard deviations for spatial uncertainty, ignoring across-subject uncertainty. (D) Decoders were constructed using 10% of the voxels from the full decoders, with voxels selected in order of their absolute magnitude, where 0 is the highest magnitude voxels and 100 is the lowest (see Fig S7). The voxels with the highest absolute weights do not necessarily discriminate better than voxels with lower magnitudes, except for pNsy in this dataset. Bars and shades are the 95% confidence intervals [CI] of AUCs, except in C, where shades indicate standard deviations associated with permutation variability. In D, colored bars indicate the AUC of the full decoders. NPS, pPV, and pNsy are published models and were trained on datasets not included in this analysis; all tests are out of sample and cross validation is not applicable.