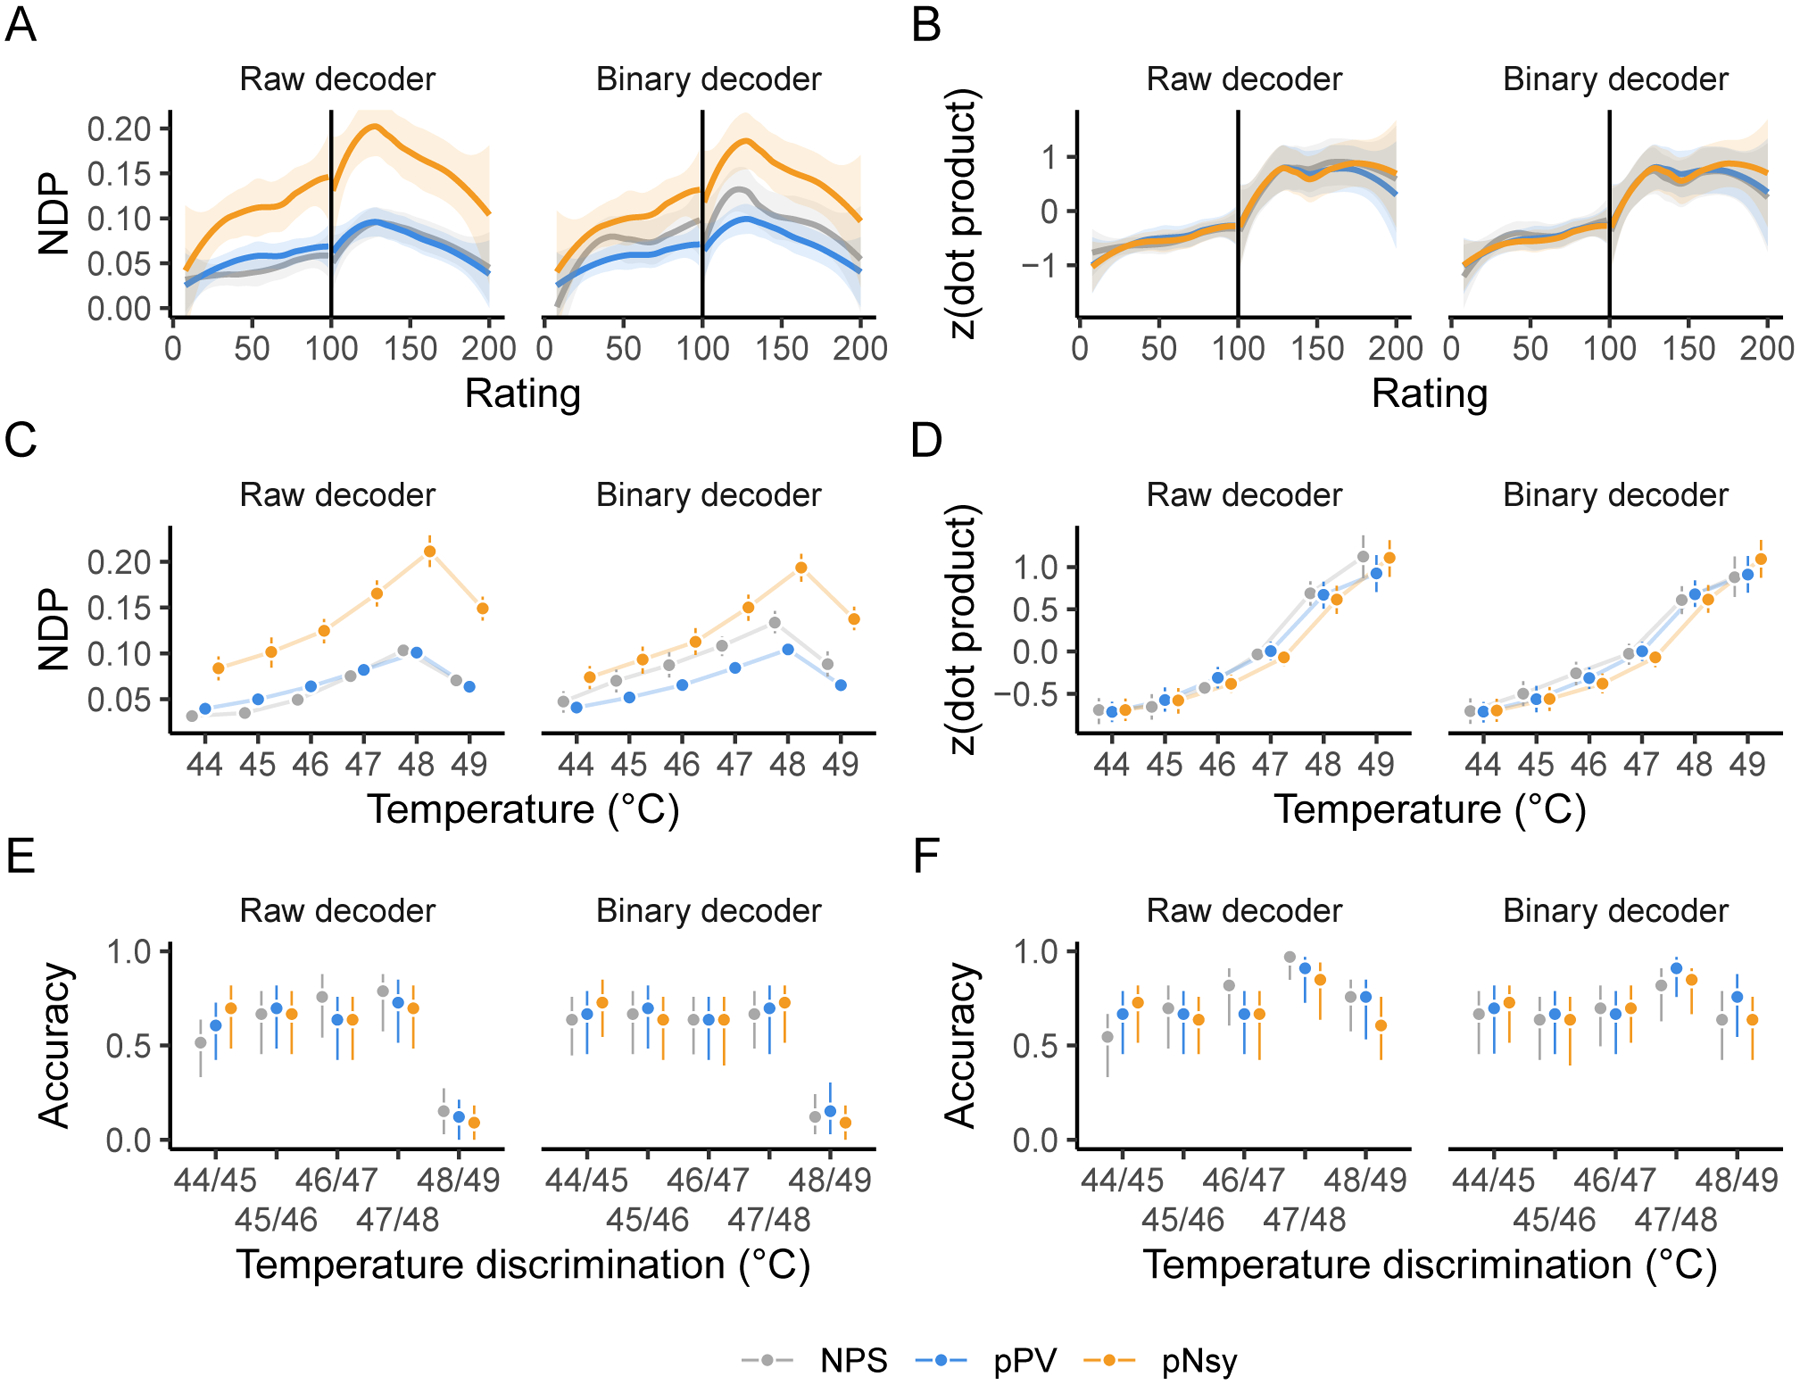
Figure 4. All three pain decoders perform stimulus-perception mapping similarly, both in their original formulations and after replacing voxel weights by binary representation (0,1 values).

When binary decoders are compared to the unfiltered (or raw) decoders, all three pain decoders perform similarly in mapping pain and heat perception ratings (A–B), mapping painful stimuli (C–D), and discriminating between pairs of painful stimuli (E–F). Analysis was done using both normalized dot product (NDP) and dot product since NDP produced results discordant with an original publication(Wager et al., 2013) that relied on dot products. Dot products that do not reliably increase with increasing pain or temperature imply that the decoders cannot reliably predict subjective ratings or stimulus intensity. Vertical lines in A and B indicate the transition from nonpainful heat (< 100) to painful heat (> 100). The dot products in B, D, and F were z-scored within each decoder for presentation purposes. NPS, pPV, and pNsy are published models and were trained on datasets not included in this analysis; all tests are out of sample and cross validation is not applicable.
