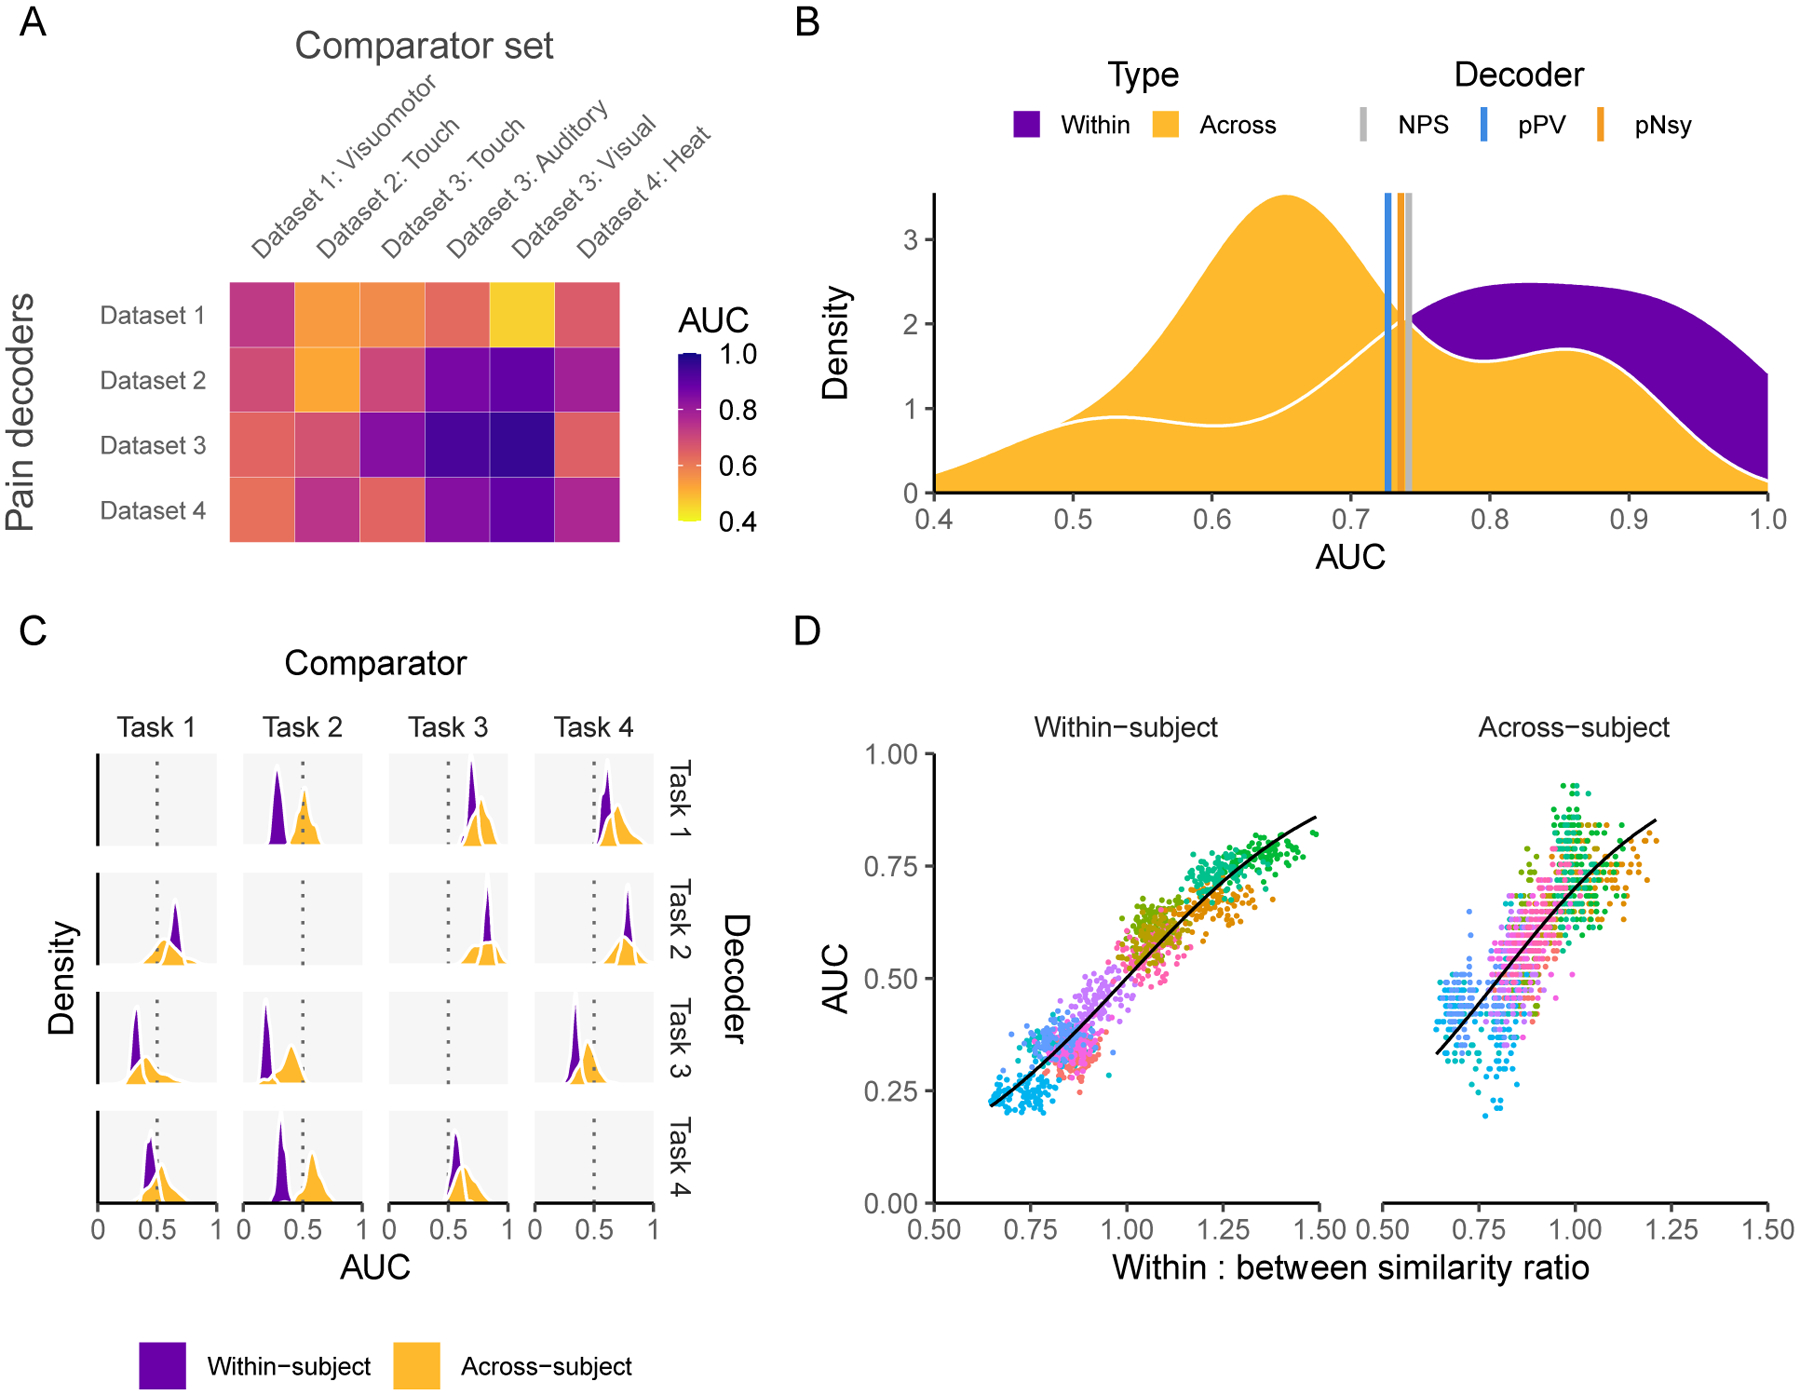
Figure 7. Decoders constructed from activity maps (encoders) perform similarly to pattern-based decoders and are dependent on both decodee and comparator properties.

(A) Performance of four activity map decoders, based on the across-subject averaging for pain tasks, to differentiate pain from six other mental states. (B) Among the activity map decoders, within study performance is slightly higher but extensively overlaps with across study performance. Meta-analytic estimates of performance for NPS, pPV, and pNsy (color lines) are within 0.4 standard deviations from the average performance of both within and across study activity map decoders. (C-D) Properties of activity map decoders are examined within and across subjects as a function of a cognitive task (mr-mr, mr-pl, pl-pl, pl-mr) (Jimura et al., 2014b). (C) Decoders (rows) are built from four cognitive tasks, tested on remaining three (columns), in a within subject and across subject design. Within subject performance is always more consistent (i.e. it has smaller variance) but not necessarily greater than across subject. For example, the within subject performance is always superior to across subject when using task 2 as the decoder. The inverse is true when task 2 is the comparator, implying strong task dependence. (D) Decoder performance scales with the ratio of decodee similarity to decodee-comparator similarity (based on normalized dot product), for within- and across-subject comparisons. Because discriminability depends on this ratio of similarities, they can be viewed as rules for decoding. Each color in (D) represents a decodee-comparator pair of tasks 1–4 in (C); each point is a permuted sample that has been shrunken towards 0.5; the black line is the fit of a beta regression (Cribari-Neto & Zeileis, 2010) across decodee-comparator pairs. In (A) the testing is a combination of within sample (also within study) for the case of: Dataset 1 – Dataset 1: Visuomotor, Dataset 2 – Dataset 2: Touch, Dataset 3 – Dataset 3: Auditory, Dataset 3 – Dataset 3: Visual, Dataset 4 – Dataset 4: Heat, and out-of-sample for all other combinations. In (C) the results are calculated using 100 permutations of randomly splitting the subjects in half, used one half for training and the second for validation.
