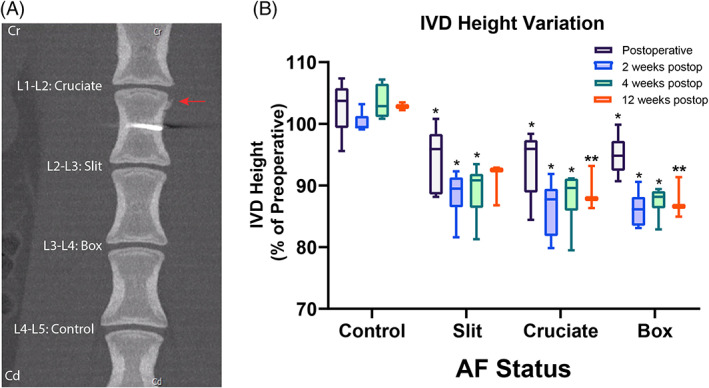
FIGURE 4.

Computed tomography (CT) imaging shows IVD height loss in all 3 defect types. (A) CT image and results from a sheep model of injured lumbar intervertebral discs using 3 different annulus fibrosus (AF) status (control; slit, cruciate, box‐cut AF defect) followed by a 0.1 g nucleus pulposus (NP) removal. Representative coronal CT image of a sheep lumbar spine 3 months after AF defect and partial NP removal showing no to minimal degenerative changes of injured disc with mild periosteal proliferation (arrow). (B) Histogram demonstrating the variation in postoperative total disc height expressed in percentage of height variation (%) compared to respective preoperative disc height according to the AF status (intact control; slit, cruciate, box‐cut AF defect injury) at each observation period (postoperative, 2 weeks, 4 weeks, and 12 weeks postoperatively). Within the same observation period, asterisks indicate a significant difference in height variation of the injured AF (slit, cruciate, box‐cut AF defect) compared to control (p < 0.05). Additionally, double asterisks indicate a significant difference between the AF status at 12 weeks postoperatively. The analysis is based on 6 IVD per AF status (pooling the 3 different IVD levels) for all observation periods except the 12 weeks postoperatively, which was based on 3 IVD per AF status
