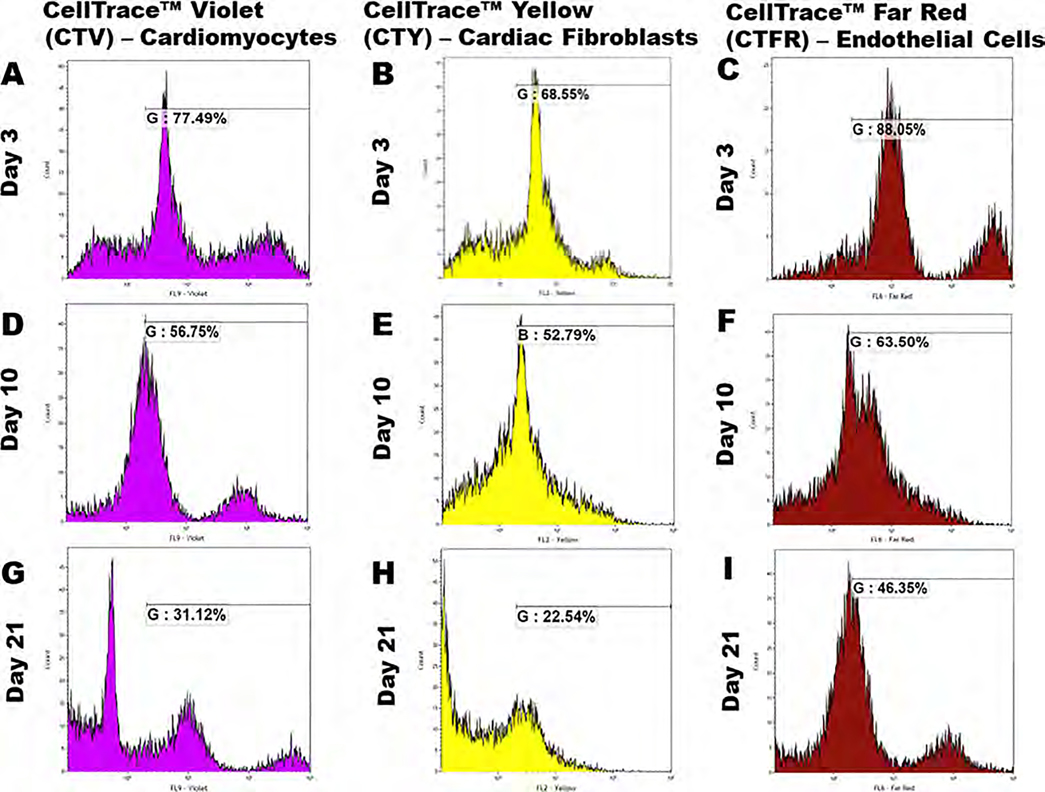
Figure 7.
FACS analysis. Cardiomyocytes were stained with CellTrace Violet, cardiac fibroblasts with CellTrace Yellow, and endothelial cells with CellTrace Far Red and mixed in a 2:2:1 ratio with the bioink prior to 3D bioprinting. After 3, 10, and 21 days, cells were extracted from the scaffolds and analyzed using a flow cytometer. Graphs (A, D, G) show the % of CTV dye intensity, (B, E, H) show the % of CTY dye intensity, and (C, F, I) show the % of CTFR dye intensity for cardiomyocytes, cardiac fibroblasts, and endothelial cells, respectively. p-values were found to be all statistically significant between the different time points (p < 0.05).

