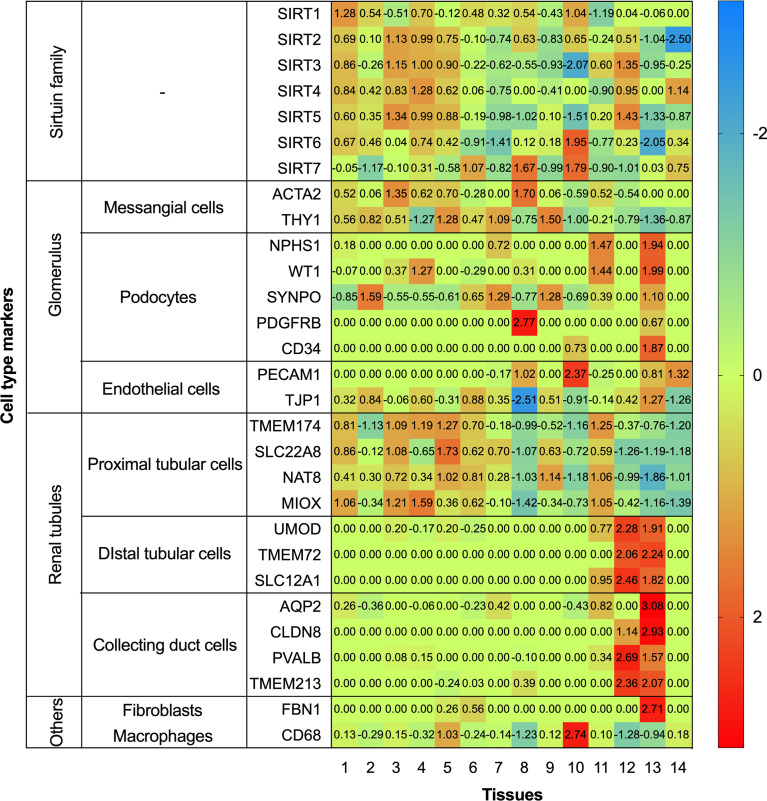
Figure 3.
Heatmap of human Sirtuin family genes with different cell type markers. Single cell transcriptomics data for kidney tissues and peripheral blood mononuclear cells were analyzed. These datasets were respectively retrieved from the Single Cell Expression Atlas (https://www.ebi.ac.uk/gxa/sc/home), the Human Cell Atlas (https://www.humancellatlas.org/), the Gene Expression Omnibus (https://www.ncbi.nlm.nih.gov/geo/), the Allen Brain Map (https://portal.brain-map.org/), and the European Genome-phenome Archive (https://www.ebi.ac.uk/ega/).

