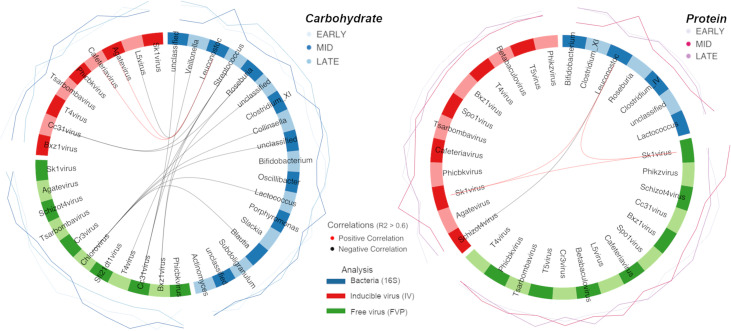
FIG 4.
Shows potential biomarkers of both HPD (a) and HCD (b) dietary intervention as identified by sPLS-DA. Significant positive (red), and negative (black), correlations with R2 values > 0.6 between features of each community are highlighted by lines joining nodes of bacterial (blue), FVP (green), and IV (red) nodes, forming the outside of the circle. Proportional abundance of each feature is illustrated by external lines colored by time point as in Fig. 2. Effect sizes of each individual feature per community are highlighted in the loadings plot and are colored by the same logic as proportional abundance.

