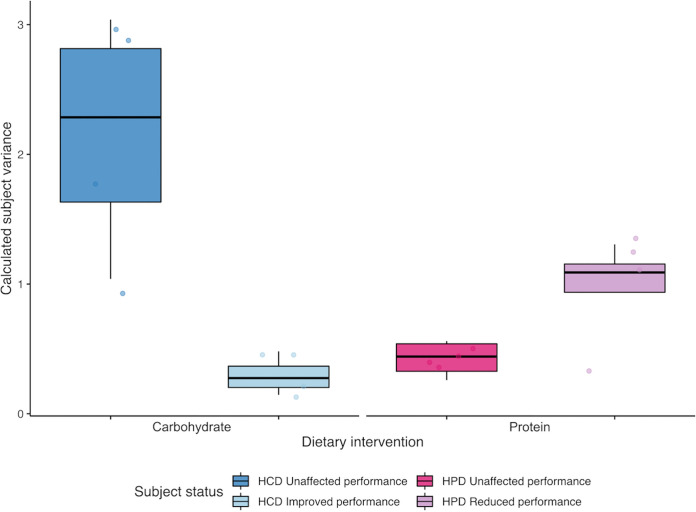
FIG 5.
Illustrates within and between subject variance based on Bray-Curtis of combined bacterial, FVP and IV community dissimilarity for participants enrolled in either the HCD (blue), or HPD (pink), interventions. Within subject variance explains the dissimilarity between samples from one individual across all three sampling time points. Between subject variance explains the dissimilarity between samples from different individuals enrolled on the same dietary intervention. Subjects are stratified in to “unaffected” (dark colors), or “improved” and “reduced” groups (light colors), dependent on TTE performance changes within each dietary group. Each point represents variance calculated for an individual subject. Box edges describe the upper and lower quartile ranges while the median is depicted by the central line. Whiskers extend to the full range of data points, excluding outliers.

