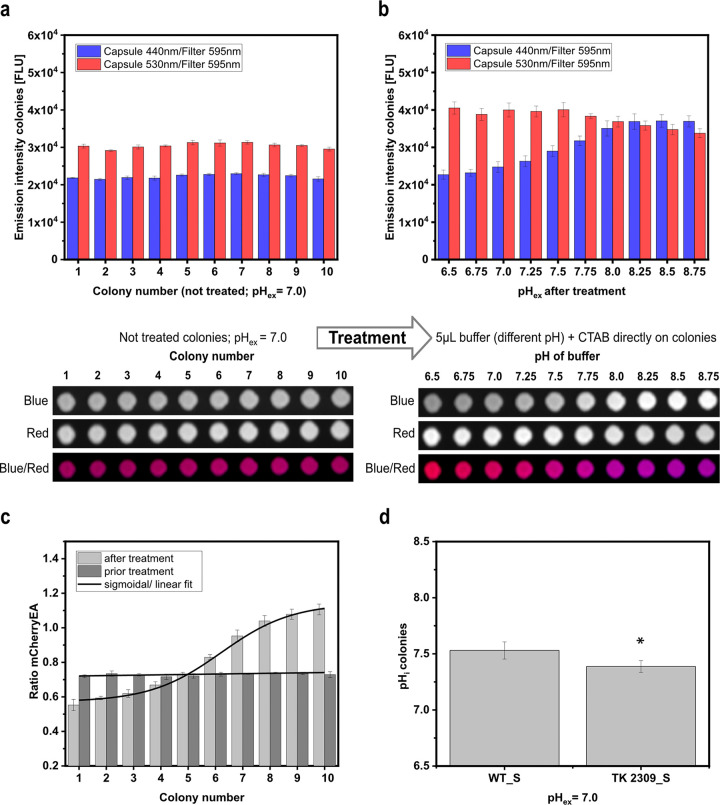
FIG 3.
mCherryEA biosensor signals in E. coli MG1655 (pXMJ19_mCherryEA) arrayed colonies on agar plate without any treatment (a) and after adding buffer with different pH values directly to the respective colonies (b). Calculated ratios prior to and after treatment of the colonies (c) and determination of the internal pH values of E. coli MG1655 (pXMJ19_mCherryEA) (WT_S) and E. coli TK2309 (pXMJ19_mCherryEA) (TK 2309_S) (d). 1 M potassium-phosphate-buffer (PBS) buffer with different set pH values was supplemented with cetyltrimethylammonium bromide (CTAB; final concentration, 0.05% [wt/vol]). Internal pH values were analyzed with one-way analysis of variance (ANOVA) followed by Tukey’s test (not significant [n.s.], P > 0.05; *, P ≤ 0.05). Error bars represent standard deviation from at least three replicates.

