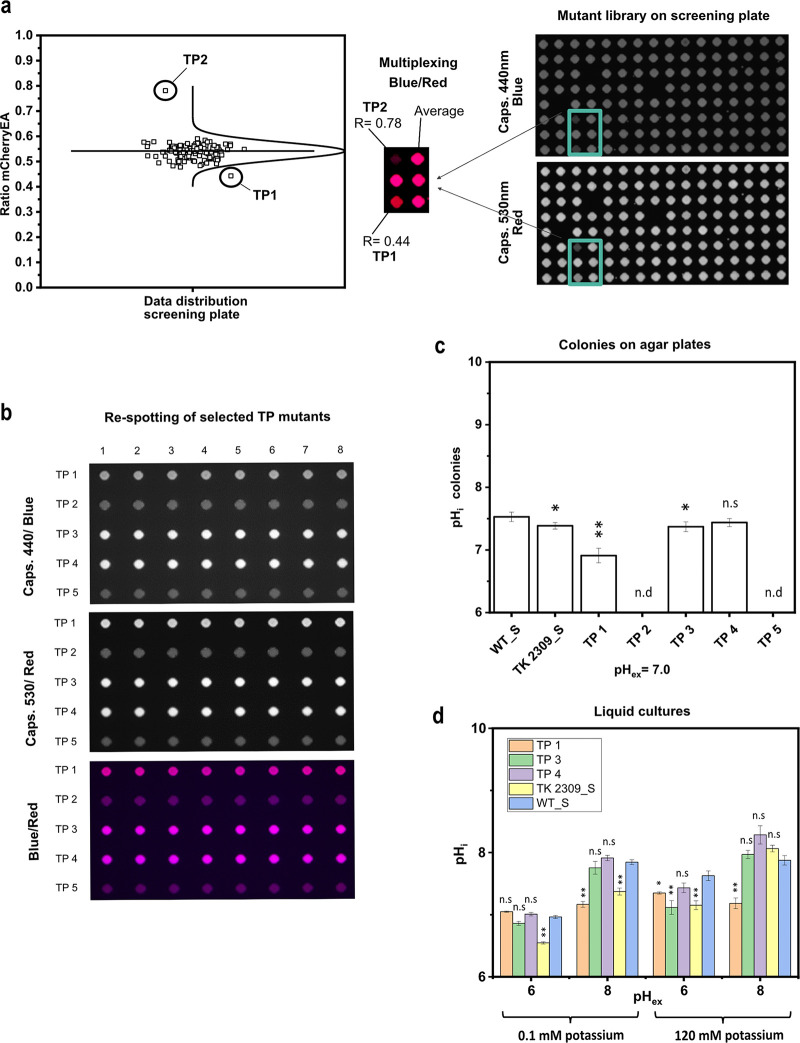
FIG 4.
Fluorescence image of a screening plate with transposon-derived mutants of E. coli MG1655 equipped with the pH sensor plasmid pXMJ19_mCherryEA (a) and different selected transposon mutants respotted in eight replicates on SB agar plates (b). The respective internal pH values of eight replicates for the selected transposon mutants were determined and compared to E. coli MG1655 (pXMJ19_mCherryEA) (WT_S) and E. coli TK2309 (pXMJ19_mCherryEA) (TK2309_S) (c). Internal pH levels of selected transposon mutants were verified and compared to WT_S and TK2309_S strains in liquid media (minimal medium, K0.1 and K120) at different external set pH values (d). Error bars represent standard deviation of at least three replicates. Statistical analysis was performed via one-way ANOVA followed by Tukey’s test (n.s., P > 0.05; *, P ≤ 0.05; **, P ≤ 0.01). Internal pH was not determined (n.d.) for TP2 and TP5 mutants due to weak biosensor expression.

