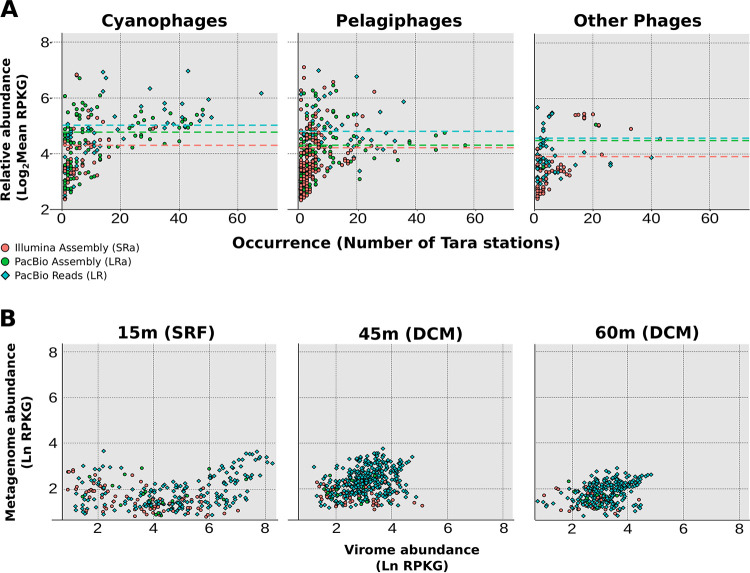
FIG 2.
(A) Relative abundance of viral sequences measured by their recruitment values in metagenomes from Tara Oceans expeditions for cyanophages, pelagiphages, and other phages. The x axis shows the number of Tara stations where the contig accumulated over the coverage thresholds, while the y axis shows the combined recruitment value (in RPKG). Circles represent contigs derived from assembly (green for hybrid assembly, orange for Illumina assembly), while blue diamonds represent raw PacBio reads. (B) Relative abundance of viral sequences in viromes (x axis) and metagenomes (y axis) obtained from the same sample at 15, 45, and 60 m, measured in ln RPKG. Circles represent contigs derived from assembly (green for hybrid assembly, orange for Illumina assembly), while blue diamonds represent raw PacBio CCS15 reads. SRF, surface; DCM, deep chlorophyll maximum.

