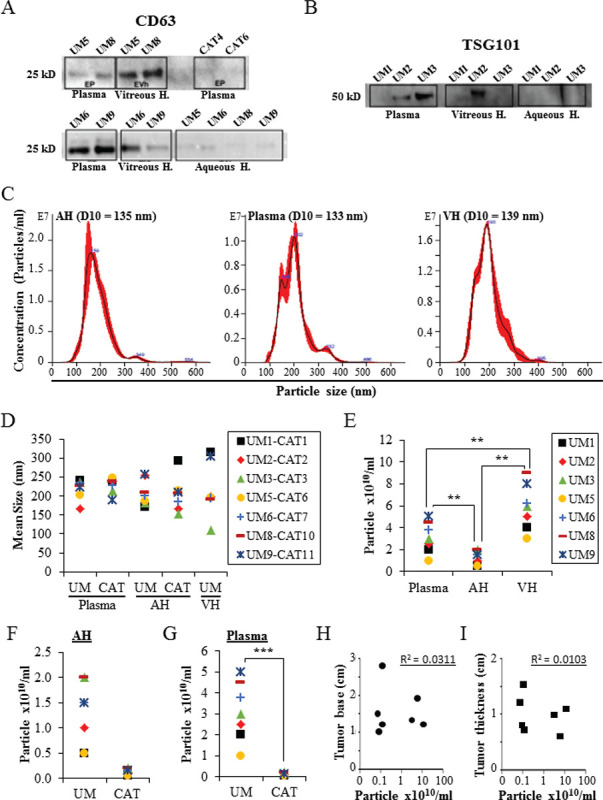
Fig. 1 -.

Characterization of EVs derived from AH, VH, and plasma. A,B) Proteins isolated from the different assay EVs (seven UM samples and two CAT samples) were analyzed by Western blot for the expression of specific EV markers (i.e., CD63 and TSG101). C) Nanosight analyses of EVs. Representative size distribution histograms showing data of EVs from AH, plasma, and VH. Note that mean EV sizes are similar. Histograms are displayed as averaged EV concentration (black line) and the variation between four repeated measurements indicating ±1 standard error of the mean (red outline). D) Mean size of EVs isolated from AH and plasma of UM (n = 7) and cataract-suffering (CAT, n = 7) patients, and from VH of UM patients (n = 7). E) Concentrations of EVs isolated from different analytes of seven UM patients. **p ˂ 0.01. F,G) Concentrations of EVs isolated from AH (F) and plasma (G) of UM (n = 7) and cataract-suffering (CAT, n = 7) patients. ***p ˂ 0.001. H and I) The concentrations of EVs isolated from the plasma of UM patients (n = 7) were plotted against ocular tumor size (base diameter (H) and thickness (I)). No correlation was found as shown by the correlation coefficient (R). Legend close to graph D applies to graphs D, F, and G. AH = aqueous humor; CAT = cataract; EV = extracellular vesicle; VH = vitreous humor; UM = uveal melanoma.
