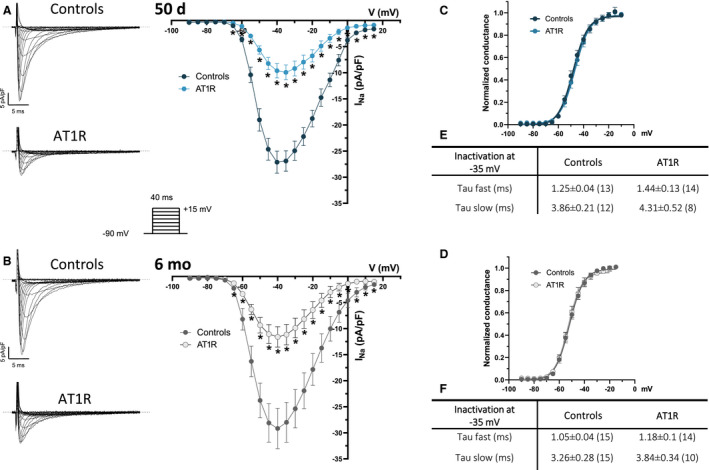
Figure 2. Electrophysiological properties of Na+ current (I Na) in left atrial myocytes of angiotensin II type 1 receptor (AT1R) and control mice.

A and B, (Left) Typical current recordings of I Na in left atrial myocytes from controls and AT1R mice (voltage protocol shown in inset). The dotted lines indicate zero current in this figure. (Right) Mean I Na current‐voltage (I–V) relationships show a reduction of I Na density in AT1R at 50 days (controls, n=13; AT1R, n=14 [*P<0.05]) and 6 months (controls, n=15; AT1R, n=15 [*P<0.05]). C and D, At both ages, neither the voltage at half‐maximal activation (V 1/2) at 50 days (controls, −47.2±1.4 mV; AT1R, −46.6±1.3 mV [P=0.7721]) and 6 months (controls, −51.6±1.1 mV; AT1R, −50.8±1.5 mV [P=0.6488]) nor the slope factor at 50 days (controls, 6.0±0.5; AT1R, 5.2±0.3 [P=0.2208]) and 6 months (controls, 5.3±0.2; AT1R, 5.1±0.3 [P=0.5430]) were affected by AT1R overexpression. Activation kinetics parameters were obtained from the activation curves fitted to the Boltzmann equation. E and F, Summary tables show that inactivation kinetics are similar between controls and AT1R mice at both 50 days (at −35 mV, Tau fast: P=0.1676; Tau slow: P=0.3526) and 6 months (at −35 mV, Tau fast: P=0.1817; Tau slow: P=0.1813). Values represent mean±SEM and *P values <0.05 vs controls, with “n” in parenthesis.
