
Figure 5. K+ currents in left atrial myocytes of controls and angiotensin II type 1 receptor (AT1R) mice.
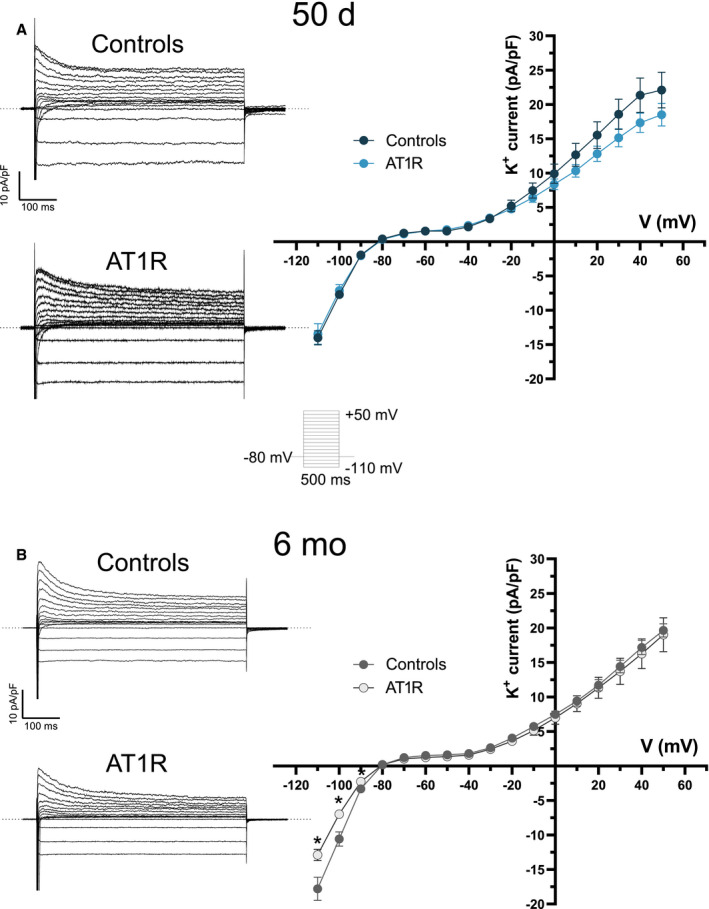
A and B, (Left) Typical recordings of total K+ currents in left atrial myocytes of controls and AT1R mice in both age groups obtained with the voltage protocol shown in inset. (Right) Mean K+ I–V relationships show no difference in K+ currents between controls and AT1R mice at 50 days (controls, n=17; AT1R, n=13). At 6 months, there was no difference in the density of the outward K+ current between the 2 groups, but a significant reduction in the inward current (I K1) between −110 mV and −90 mV (6 months: controls, n=15; AT1R, n=9) was observed in AT1R mice.