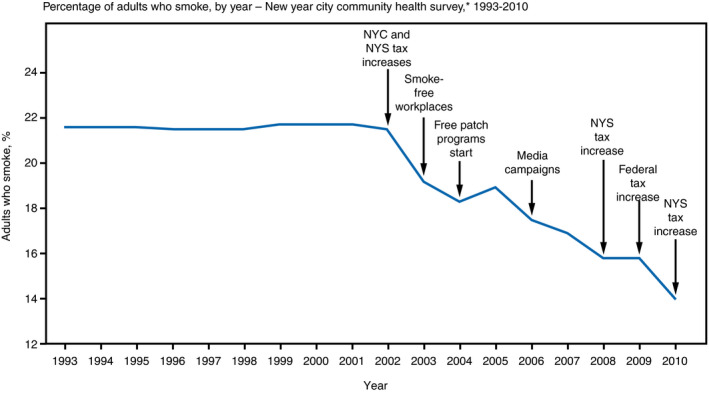
Figure 2. Surveillance depicted graphically.

The essence of surveillance can be perceived graphically with time along the horizontal axis and some health metric along the vertical: absolute values of a metric quantify the state of an issue, while contemporary values interpreted in the context of historical trends describe its trajectory (ie, improving, worsening, or stable). In this surveillance graph, smoking rates in New York City (NYC) were largely constant from 1993 to 2002, but then consistently decreased through 2010. Superimposed on the surveillance graph are the timing of various interventions designed to improve the surveilled metric. 7 NYS indicates New York State.
