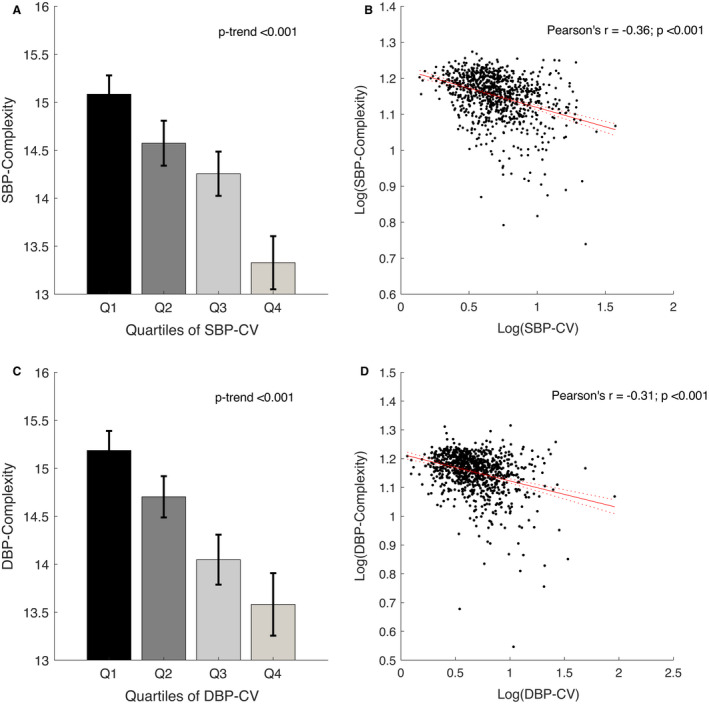
Figure 1. Correlations of blood pressure complexity with measures of blood pressure variability.

Systolic blood pressure (SBP) complexity vs SBP coefficient of variation (CV) (A and B) and diastolic blood pressure (DBP) complexity vs DBP‐CV (C and D), stratified by quartiles and for the linear regression with a log transformation of both indexes to normalize the data and improve validity of the regression model. Values of P‐trend are given for linear regression. Data are presented as mean with 95% CI and regression line with 95% CI.
