
Figure 2. Changes of beat‐to‐beat blood pressure variability and complexity, stratified by sex and by quintiles (Qs) of age.
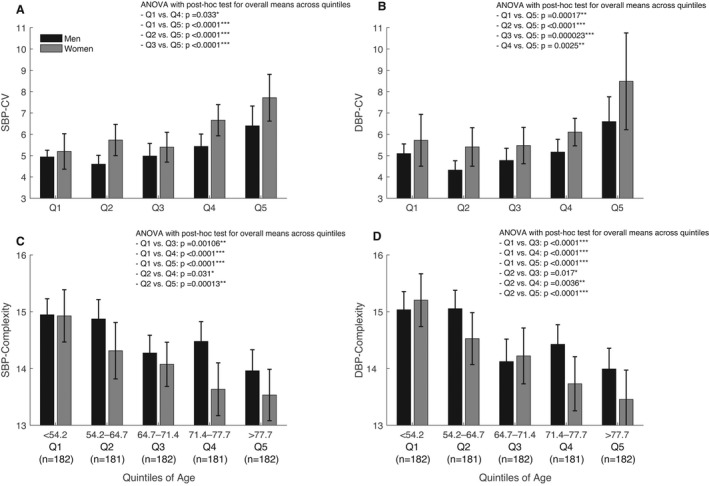
A, Systolic blood pressure (SBP) coefficient of variation (CV). B, Diastolic blood pressure (DBP) CV. C, Complexity of SBP. D, Complexity of DBP. P values are given for ANOVA with post hoc analysis (Tukey test) for comparisons among the overall means across the 5 quintiles. Only the results that reach the statistically significant level are presented. Data are presented as mean with 95% CI. *P<0.05, **P<0.01, and ***P<0.001.