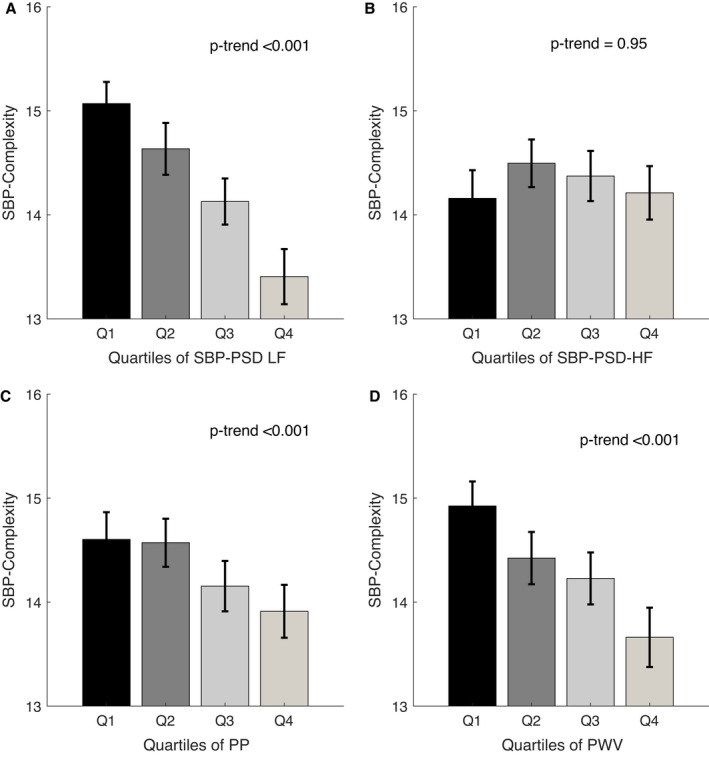
Figure 4. Values of complexity of systolic blood pressure (SBP), stratified by quartiles (Qs) of parameters of SBP power spectrum density (PSD) in low‐frequency (LF) (A) and high‐frequency (HF) (B) bands; and indexes of vascular aging of pulse pressure (PP) (C) and pulse wave velocity (PWV) (D).

Patients (n=93) who did not have PWV assessed were not included. Values of P‐trend are given for linear regression. Data are presented as mean with 95% CI.
