
Figure 1. Association between residential segregation and incident hypertension among non‐Hispanic Black participants, by percentile of neighborhood social environment: the Multi‐Ethnic Study of Atherosclerosis, 2000 to 2018.
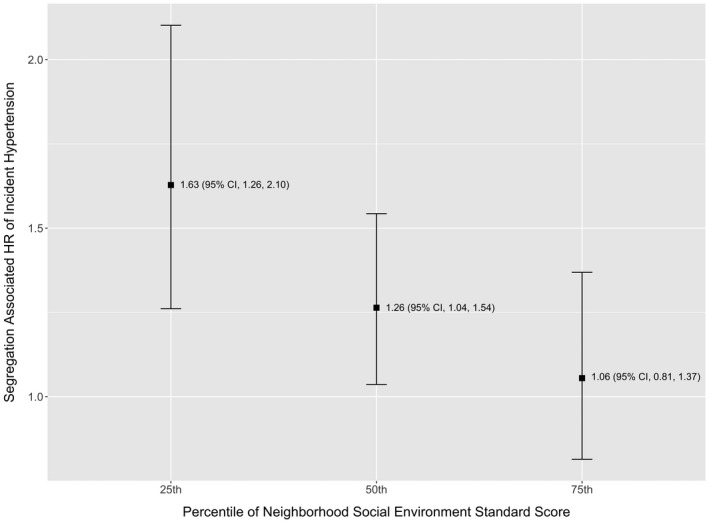
Model adjusted for age, sex, education, per capita adjusted income, body mass index, and physical activity. P value for interaction between segregation and social environment=0.0108. Standardized social environment is displayed from worse (25th percentile) to better (75th percentile). HR indicates hazard ratio.