
Figure 3. The association of body mass index (BMI) with clinical outcomes.
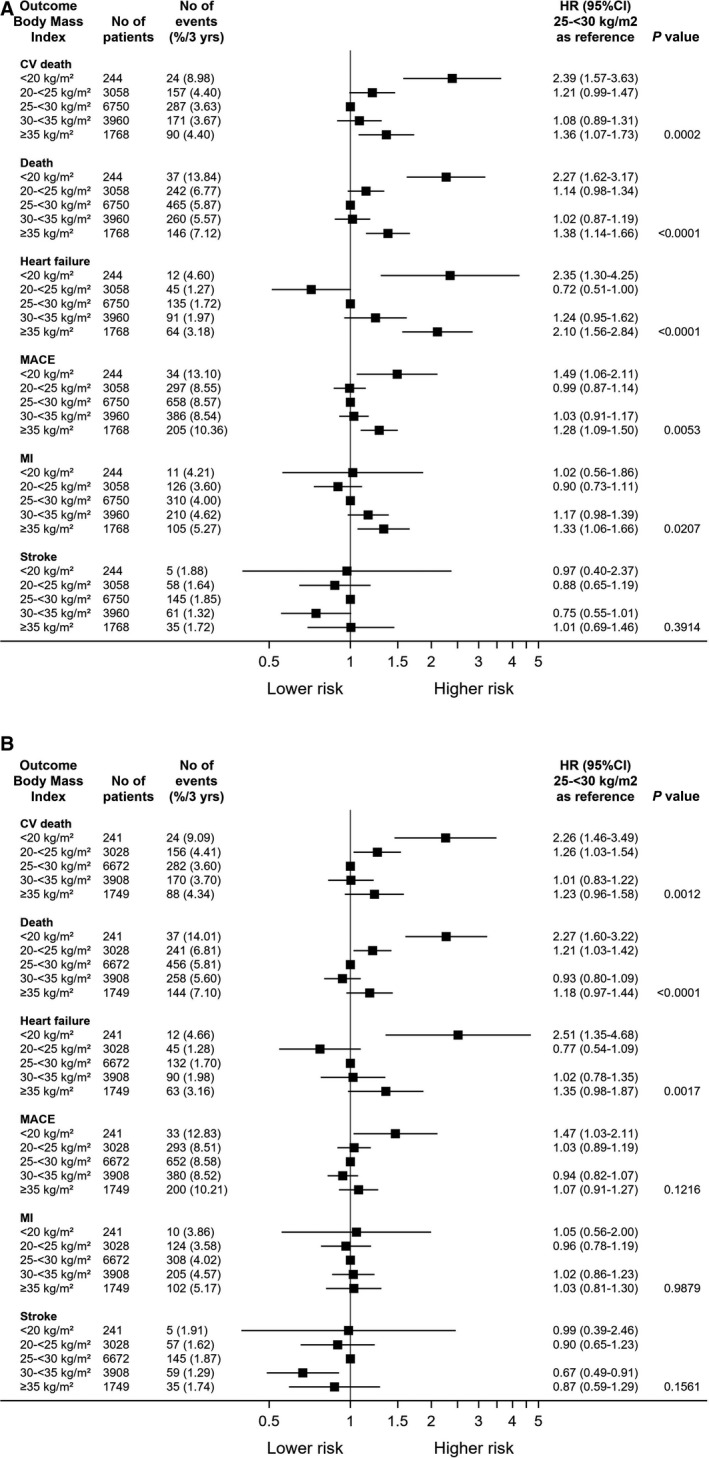
(A) Basic adjustment model. (B) Fully adjusted. (A) BMI 25 < 30 kg/m2 as reference. Adjusted for age, sex, and randomized treatment. P value denotes difference between groups. (B) BMI of 25 < 30 kg/m2 as reference. Adjusted for age, sex, and randomized treatment, prior percutaneous coronary intervention (PCI)/coronary artery bypass grafting (CABG), prior MI, renal dysfunction, polyvascular disease, diabetes, smoking, stroke/transient ischemic attack (TIA), congestive heart failure, systolic blood pressure, geographic region, chronic obstructive pulmonary disease (COPD), cancer diagnosis and Asian/Japanese origin. P value denotes difference between groups. CV indicates cardiovascular; MACE, major adverse cardiovascular event; and MI, myocardial infarction.