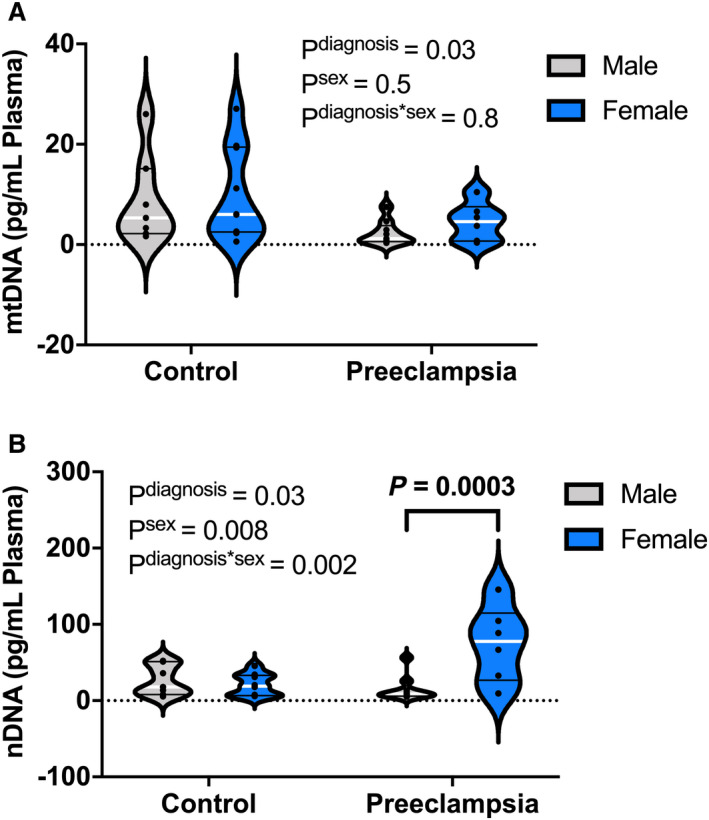
Figure 3. Effect of fetal sex on maternal plasma concentrations of cell‐free DNA.

Membrane bound (A) ccf‐mtDNA (pg/mL) and (B) ccf‐nDNA (pg/mL) in plasma from pregnant women carrying female (control, n=9; preeclampsia, n=6) and male fetuses (control, n=7; preeclampsia, n=10). Data analyzed by 2‐way analysis of variance with Sidak’s post hoc analysis. All values presented as median (white line), interquartile range (black lines). nDNA, nuclear DNA; ccf‐mtDNA, circulating cell‐free mitochondrial DNA; ccf‐nDNA, circulating cell‐free nuclear DNA.
