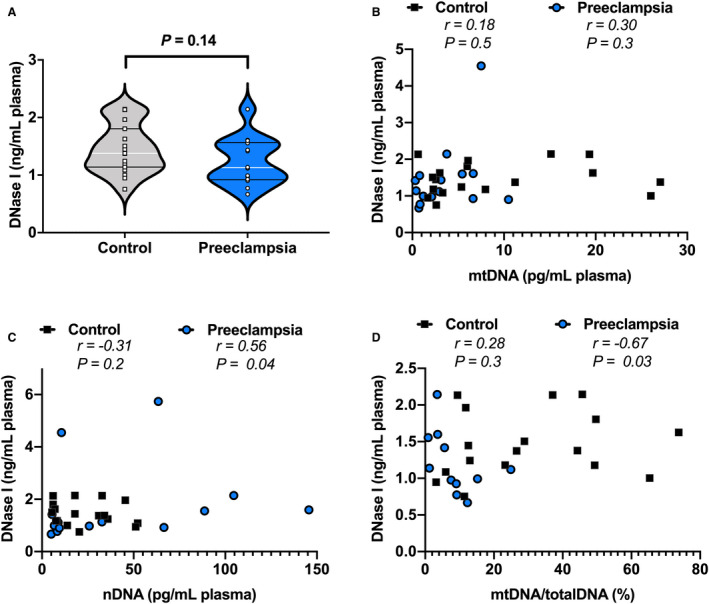
Figure 5. Maternal plasma concentrations of DNase I measured in healthy pregnancies and pregnancies with preeclampsia.

A, DNase I concentrations (ng/mL) in maternal plasma (controls, n=19; preeclampsia, n=14), and DNase I plotted as a concentration against (B) ccf‐mtDNA concentration (pg/mL) in plasma, (C) nDNA concentration (pg/mL), and (D) ccf‐mtDNA as a percent of total DNA. A, Student’s t‐test, values presented as median (white line), IQR (black lines). B through D, Spearman correlation with r and P values presented for each analysis. ccf‐mtDNA and nDNA used for Spearman correlations were derived from samples treated with lysis buffer to extract DNA. nDNA, nuclear DNA; ccf‐mtDNA, cell‐free circulating mitochondrial DNA; totalDNA, sum of ccf‐mtDNA and nDNA. Open squares=gestational age‐matched control; open circles=third trimester pregnancies with preeclampsia.
