
Figure 2. Forest plot for CVD, CHD, stroke, and fatal CVD comparing parous women who ever breastfed vs never breastfed.
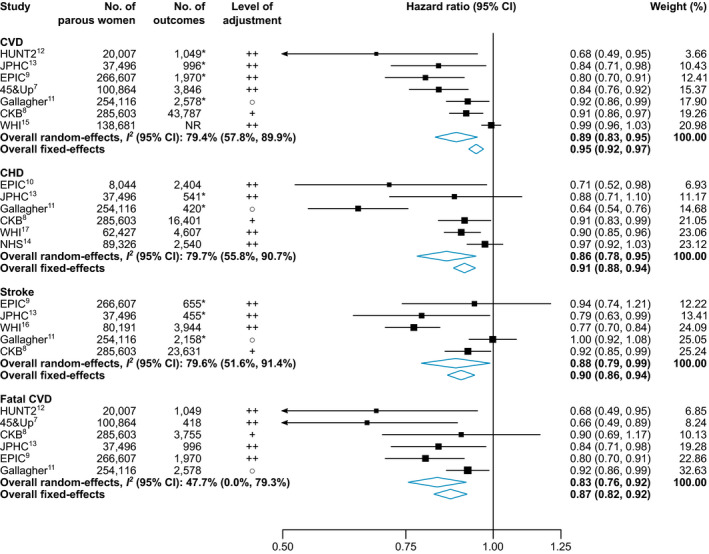
*Only fatal events included. ○, adjusted for demographics and reproductive factors; +, adjusted for demographics and cardiovascular risk factors; ++, adjusted for demographics, reproductive factors, and cardiovascular risk factors. Full study names are provided in the footnotes of the Table. CHD indicates coronary heart disease; and CVD, cardiovascular disease.