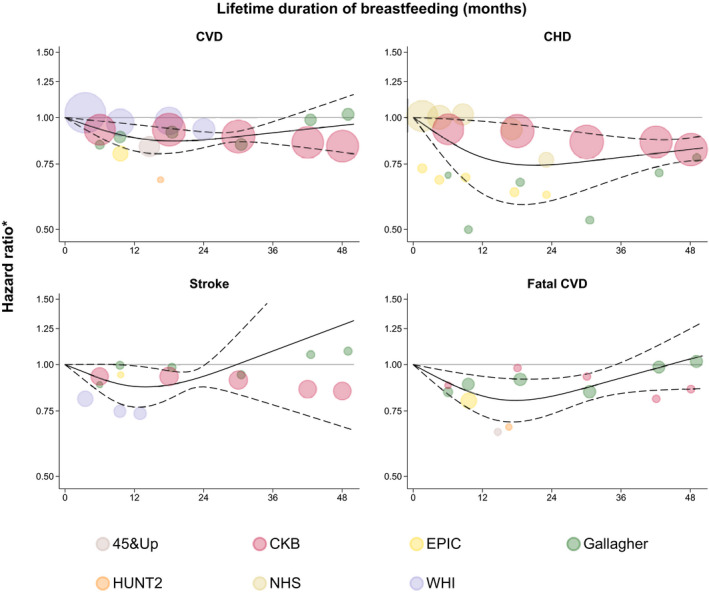
Figure 3. Different lengths of lifetime duration of breastfeeding and incidence of cardiovascular outcomes.

*Comparing women with different lifetime durations of breastfeeding with parous women who never breastfed. The solid lines indicate fitted restricted cubic splines and the dashed lines their 95% CIs. The sizes of the circles are proportional to the inverse variance of the hazard ratios. Full study names are provided in the footnotes of the Table. For the purpose of presentation, the graph for stroke has been truncated at 1.50 at the y axis. CHD indicates coronary heart disease; and CVD indicates cardiovascular disease.
