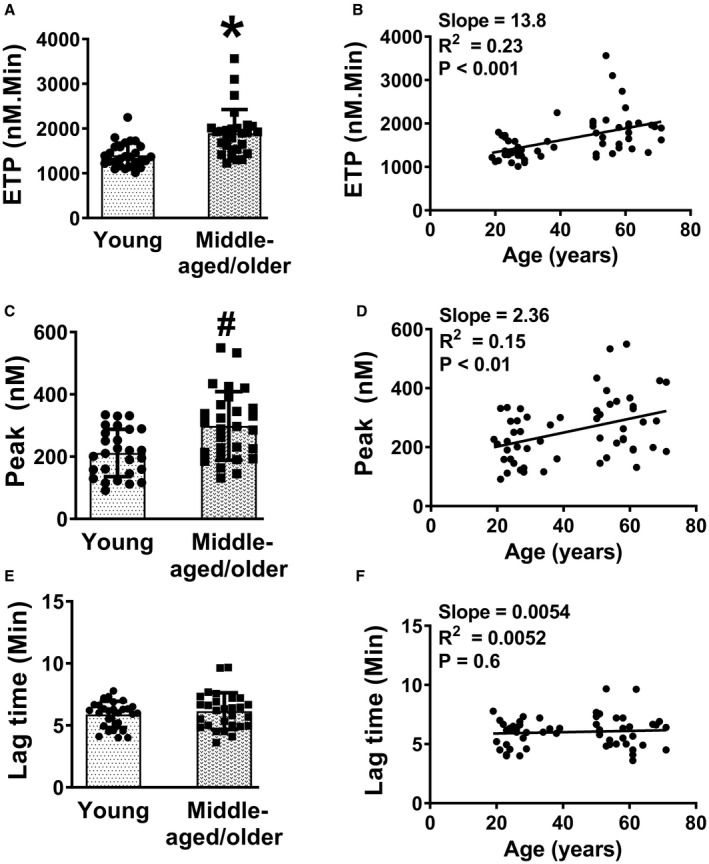
Figure 6. Human aging is associated with increased thrombin generation.

Thrombin generation was measured using platelet poor plasma from young and middle‐aged/older subjects. A, Endogenous thrombin potential (ETP). B, Linear regression analysis of ETP with age. C, Peak thrombin generation. D, Linear regression analysis of peak thrombin generation with age. E, Lag time. F, Linear regression analysis of lag time with age. Data for (A, C, and E) are expressed as mean±SD *P<0.0001 and # P<0.01 vs young subjects. Unpaired t test for (A, C, and E) and linear regression for (B, D, and F). N=27 to 28 in each group.
