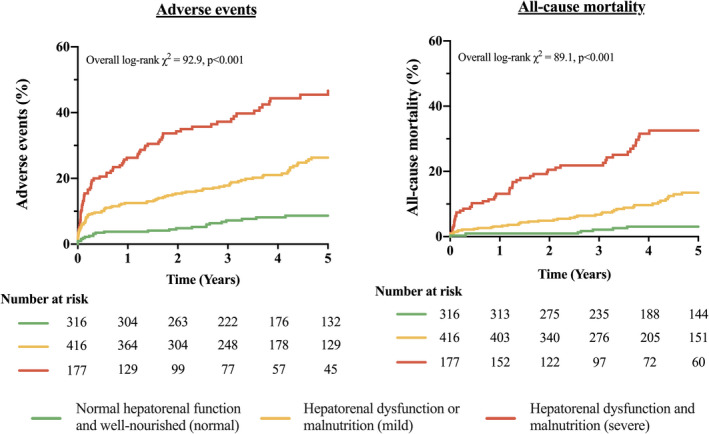
Figure 3. Kaplan–Meier curves for all‐cause mortality and adverse events by postoperative hepatorenal dysfunction (MELD‐XI) and malnutrition (CONUT).

CONUT indicates Controlling Nutritional Status score; and MELD‐XI, Model for End‐Stage Liver Disease excluding international normalized ratio.
