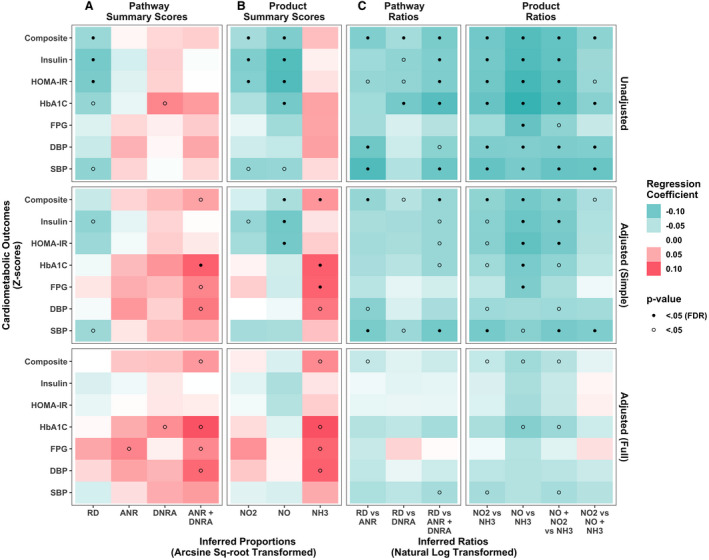
Figure 2. Association between various measures of nitrogen metabolism and cardiometabolic risk Z scores, unadjusted, adjusted for sex, age, race and ethnicity in the simple adjusted model, and additionally for education, smoking status, body mass index, and periodontal disease in the fully adjusted model. Results from n=764 participants in the ORIGINS (Oral Infections, Glucose Intolerance, and Insulin Resistance Study).

This heatmap represents the β coefficients (change in cardiometabolic risk Z score per 1 SD increase in metagenomic variable) from (1) unadjusted linear regression models (upper panels), (2) simple adjusted multivariable linear regression models (middle panels), and (3) fully adjusted multivariable linear regression models (lower panels) regressing cardiometabolic risk Z scores on the following measures of nitrogen metabolism. A, Abundance of microbial genes in the following 3 pathways were considered: respiratory denitrification (RD), dissimilatory nitrate reduction to ammonia (DNRA), and assimilatory nitrate reduction (ANR). B, Abundance of microbial genes for reductase enzymes that produce the following biochemical products: NO2, NO, and NH3. C, Nitrite generation vs depletion ratios of microbial gene abundances for pathways (RD vs ANR, RD vs DNRA, RD vs ANR+DNRA) or products (NO2 vs NH3, NO vs NH3, NO+NO2 vs NH3, NO2 vs NO+NH3). Green represents inverse associations, and red represents positive associations. Darker colors represent a larger effect estimate. The values from the analyses used to create this heatmap are presented in Table S3. DBP indicates diastolic blood pressure; FDR, false discovery rate; FPG, fasting plasma glucose; HbA1c, hemoglobin A1c; HOMA‐IR, Homeostatic Model Assessment of Insulin Resistance; NH3, ammonia; NO2, nitrite; and SBP, systolic blood pressure.
