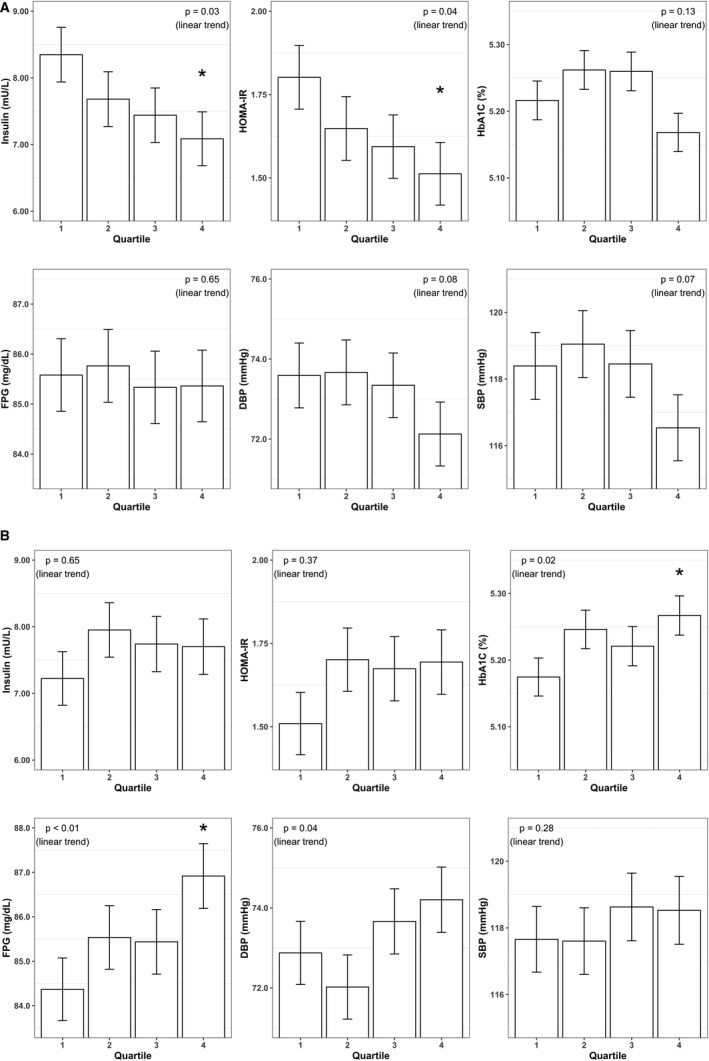
Figure 3. Plasma insulin, Homeostatic Model Assessment of Insulin Resistance (HOMA‐IR), hemoglobin A1c (HbA1c), fasting plasma glucose (FPG), diastolic blood pressure (DBP), and systolic blood pressure (SBP) values across increasing quartiles of (A) NH3 product summary score and (B) NO vs NH3 nitrite generation to depletion predicted gene abundance ratio.

In fully adjusted models controlling for sex, age, race and ethnicity, education, smoking status, body mass index, and periodontal disease status. * P<0.05 for pairwise comparisons between the first and fourth quartile. NH3 indicates ammonia.
