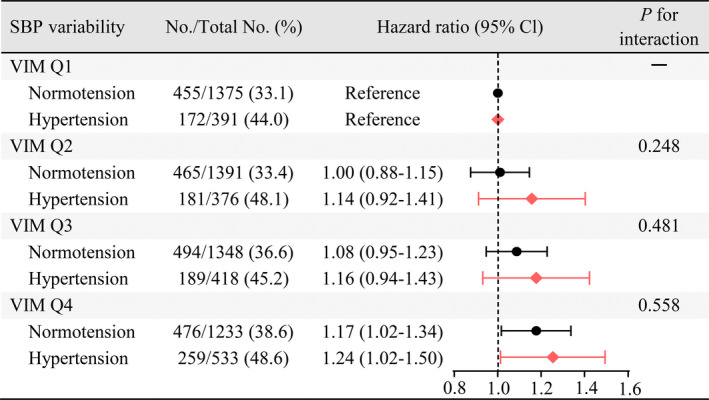
Figure 2. Association between visit‐to‐visit SBP variability measured by VIM and MACE in adults with optimal SBP levels and with or without hypertension.

The HRs and 95% CIs were obtained from Cox proportional hazard regression models adjusted for age, sex, race, education level, body mass index, smoking status, alcohol use status, total cholesterol, high‐density lipoprotein cholesterol, prevalent diabetes, use of aspirin and statins, use of antihypertensive drugs, diastolic blood pressure at visit 3, and trend and mean of SBP from visit 1 to visit 3. P for interaction between hypertension and SBP variability (VIM) from the fully adjusted model is also displayed. HR indicates hazard ratio; MACE, major adverse cardiovascular event; Q, quartile; SBP, systolic blood pressure; and VIM, variability independent of the mean.
