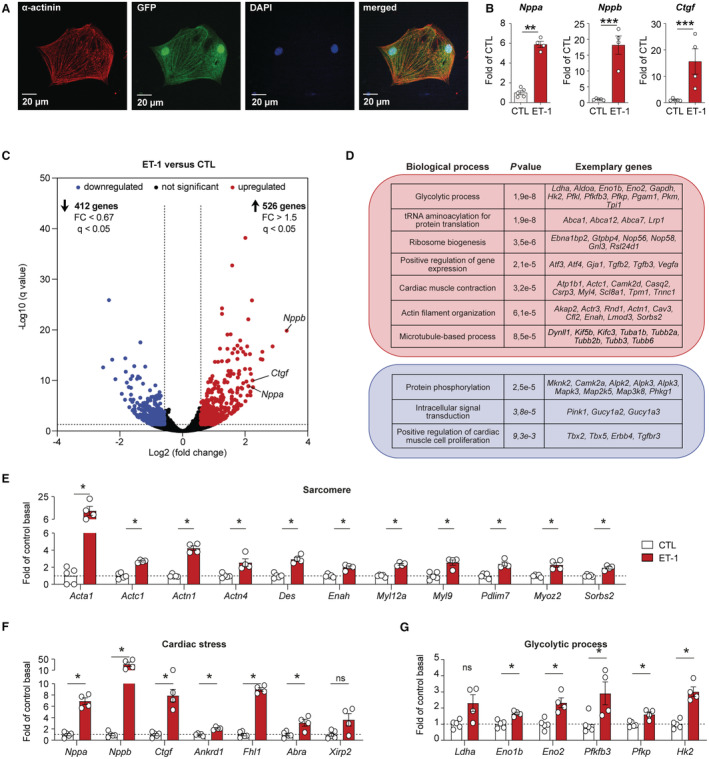
Figure 1. Pathological gene expression induced by endothelin‐1 in embryonic stem cell‐derived cardiac myocytes.

A, Representative immunofluorescence staining of cardiac α‐actinin (1:500, red) in GFP (green fluorescent protein)‐positive embryonic stem cell‐derived cardiac myocytes (ES‐CM, green). Nuclei are counterstained with DAPI (1:1000, blue). B, Gene expression of natriurectic peptide precursor A (Nppa) and B (Nppb) or connective tissue growth factor (Ctgf) in control (CTL) ES‐CM and in ES‐CM treated with endothelin‐1 (ET‐1, 100 nmol/L) were determined by quantitative reverse transcription polymerase chain reaction (n=4–8 per group, mean±SEM, Student t test, **P<0.01, ***P<0.001). C, Volcano plot showing RNA‐seq data of significantly upregulated (red) and downregulated genes (blue) in ES‐CM treated with ET‐1 compared with control (CTL) ES‐CM (n=4–5, normalized counts >1, fold change >1.5 or <0.67, q<0.05). D, Gene ontology analysis using the Database for Annotation, Visualization and Integrated Discovery for significantly upregulated genes (red box) and downregulated genes (blue box) that are shown in (C). E through G, Gene expression of differentially regulated genes associated with sarcomere, cardiac stress, or glycolytic process in control and ET‐1 treated ES‐CM as derived from RNA‐seq (n=4–5 per group, mean±SEM, *q<0.05).
