
Figure 2. Epigenetic inhibitors prevent part of the pathological gene program.
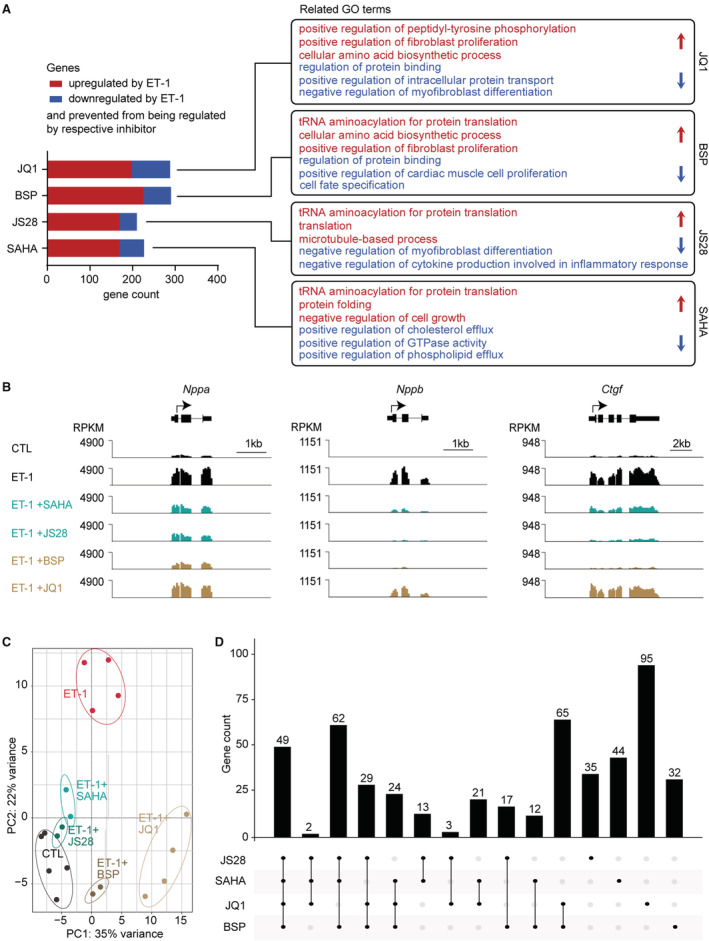
A, Gene ontology (GO) analysis of up‐ (red) or downregulated (blue) genes in embryonic stem cell‐derived cardiac myocytes (ES‐CM) by endothelin‐1 (ET‐1, normalized counts >1, 1.5‐fold down−/upregulated, q<0.05, n=2–5) that were prevented from being regulated by treatment with the indicated inhibitors. B, Representative traces showing the impact of epigenetic inhibitors on natriurectic peptide precursor A (Nppa) and B (Nppb) or connective tissue growth factor (Ctgf) gene expression. C, Principal component (PC) analysis plot from DEseq2 visualizing similarities and differences among samples from control ES‐CM, from ES‐CM treated with ET‐1 alone and ES‐CM treated with indicated inhibitors in presence of ET‐1. D, Summarizing the number of genes that were prevented from being regulated by the respective inhibitor and the overlap between different compounds. BSP indicates bromosporine; CTL, control; RPKM, reads per kilobase per million mapped; and SAHA, suberoylanilide hydroxamic acid.