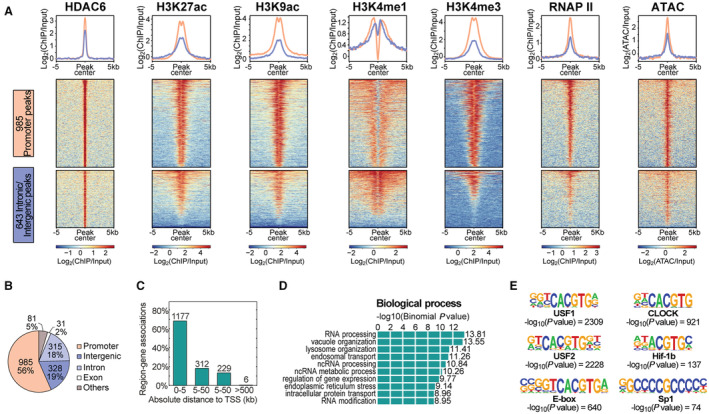
Figure 3. Genomic distribution of the JS28 inhibitor target HDAC6.

A, Heatmaps illustrating all histone deacetylase 6 (HDAC6) peaks at the promoter (pink) and at intronic/intergenic regions (blue) and their association with histone modifications, RNAP II (RNA polymerase II), and chromatin accessibility as derived from ATAC. B, Genome‐wide localization of all 1740 HDAC6 peaks and (C) the distribution of all HDAC6 peaks in distance to the transcription start site (TSS) of the nearest gene in kilobases (kb). D, Gene ontology analysis of genes associated with HDAC6 peaks. E, Significantly enriched transcription factor binding motifs within HDAC6 peaks. ATAC indicates assay for transposase‐accessible chromatin.
